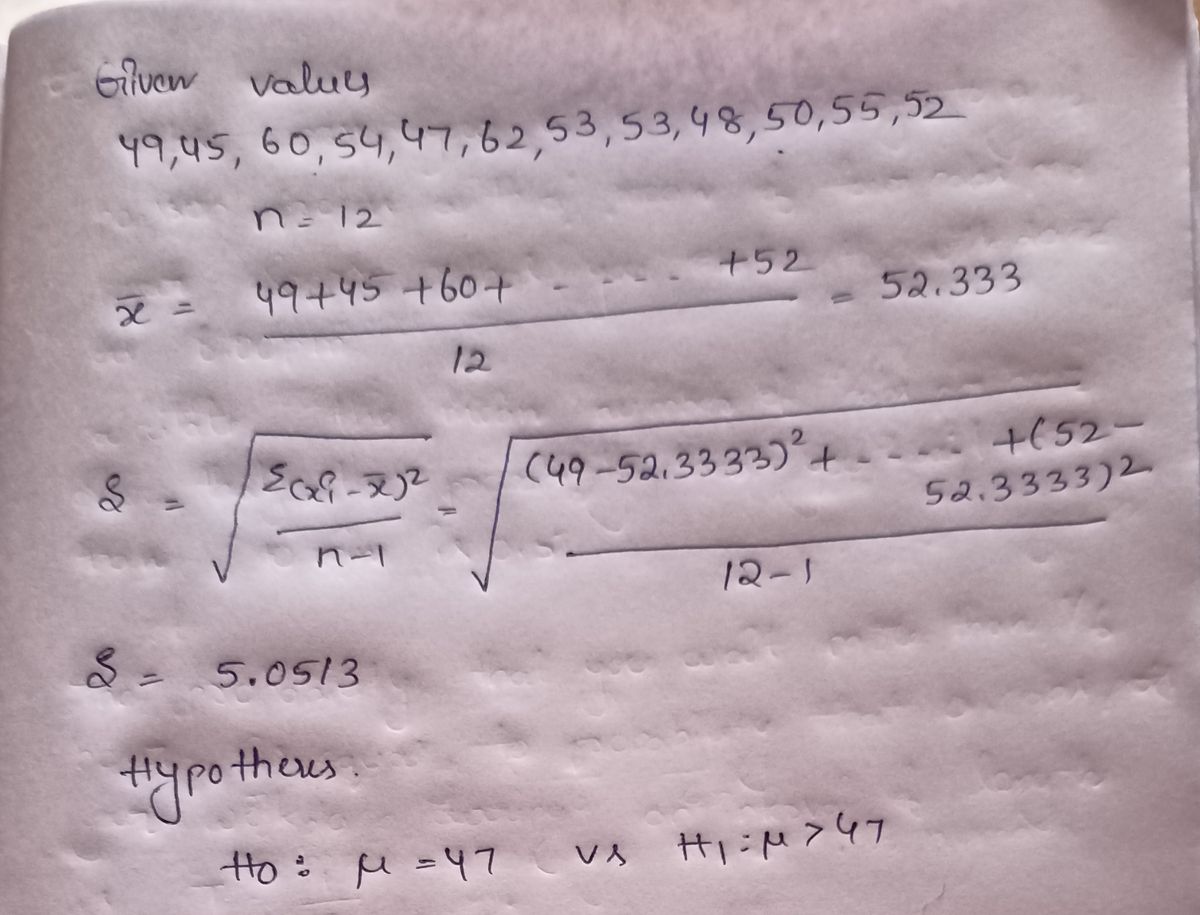
The work week for adults in the US that work full time is normally distributed with a mean of 47 hours. A newly hired engineer at a start-up company believes that employees at start-up companies work more on average then most working adults in the US. She asks 12 engineering friends at start-ups for the lengths in hours of their work week. Their responses are shown in the table below. Test the claim using a 1% level of significance. Give answer to at least 4 decimal places. Hours 49 45 60 54 47 62 53 53 48 50 55 52 What are the correct hypotheses? Họ: Select an answer hours H1: Select an answer ? v hours Based on the hypotheses, find the following: Test Statistic= p-value- The correct decision is to Select an answer The correct summary would be: Select an answer v that the mean number of hours of all employees at start-up companies work more than the US mean of 47 hours.
The work week for adults in the US that work full time is normally distributed with a mean of 47 hours. A newly hired engineer at a start-up company believes that employees at start-up companies work more on average then most working adults in the US. She asks 12 engineering friends at start-ups for the lengths in hours of their work week. Their responses are shown in the table below. Test the claim using a 1% level of significance. Give answer to at least 4 decimal places. Hours 49 45 60 54 47 62 53 53 48 50 55 52 What are the correct hypotheses? Họ: Select an answer hours H1: Select an answer ? v hours Based on the hypotheses, find the following: Test Statistic= p-value- The correct decision is to Select an answer The correct summary would be: Select an answer v that the mean number of hours of all employees at start-up companies work more than the US mean of 47 hours.

MATLAB: An Introduction with Applications
6th Edition
ISBN:9781119256830
Author:Amos Gilat
Publisher:Amos Gilat
Chapter1: Starting With Matlab
Section: Chapter Questions
Problem 1P

Related questions
Question
100%
![The work week for adults in the US that work full time is normally distributed with a mean of 47 hours. A newly hired engineer at a start-up company believes that employees at start-up companies work more on average than most working adults in the US. She asks 12 engineering friends at start-ups for the lengths in hours of their work week. Their responses are shown in the table below. Test the claim using a 1% level of significance. Give the answer to at least 4 decimal places.
**Hours:**
- 49
- 45
- 60
- 54
- 47
- 62
- 53
- 53
- 48
- 50
- 55
- 52
**What are the correct hypotheses?**
- \( H_0: \) [Select an answer] [ ? ] [ ] hours
- \( H_1: \) [Select an answer] [ ? ] [ ] hours
**Based on the hypotheses, find the following:**
- Test Statistic = [ ]
- p-value = [ ]
**The correct decision is to** [Select an answer] **.**
**The correct summary would be:** [Select an answer] that the mean number of hours of all employees at start-up companies work more than the US mean of 47 hours.](/v2/_next/image?url=https%3A%2F%2Fcontent.bartleby.com%2Fqna-images%2Fquestion%2F64061994-5f1c-449d-8fb6-0cc2c5134779%2F8af8d1c9-fab6-4a7f-8e68-7d82f4bc1ad1%2Ft4qhbb6_processed.png&w=3840&q=75)
Transcribed Image Text:The work week for adults in the US that work full time is normally distributed with a mean of 47 hours. A newly hired engineer at a start-up company believes that employees at start-up companies work more on average than most working adults in the US. She asks 12 engineering friends at start-ups for the lengths in hours of their work week. Their responses are shown in the table below. Test the claim using a 1% level of significance. Give the answer to at least 4 decimal places.
**Hours:**
- 49
- 45
- 60
- 54
- 47
- 62
- 53
- 53
- 48
- 50
- 55
- 52
**What are the correct hypotheses?**
- \( H_0: \) [Select an answer] [ ? ] [ ] hours
- \( H_1: \) [Select an answer] [ ? ] [ ] hours
**Based on the hypotheses, find the following:**
- Test Statistic = [ ]
- p-value = [ ]
**The correct decision is to** [Select an answer] **.**
**The correct summary would be:** [Select an answer] that the mean number of hours of all employees at start-up companies work more than the US mean of 47 hours.
Expert Solution
Step 1

Step by step
Solved in 2 steps with 2 images

Recommended textbooks for you
MATLAB: An Introduction with Applications
Statistics
ISBN:
9781119256830
Author:
Amos Gilat
Publisher:
John Wiley & Sons Inc

Probability and Statistics for Engineering and th…
Statistics
ISBN:
9781305251809
Author:
Jay L. Devore
Publisher:
Cengage Learning

Statistics for The Behavioral Sciences (MindTap C…
Statistics
ISBN:
9781305504912
Author:
Frederick J Gravetter, Larry B. Wallnau
Publisher:
Cengage Learning
MATLAB: An Introduction with Applications
Statistics
ISBN:
9781119256830
Author:
Amos Gilat
Publisher:
John Wiley & Sons Inc
Probability and Statistics for Engineering and th…
Statistics
ISBN:
9781305251809
Author:
Jay L. Devore
Publisher:
Cengage Learning
Statistics for The Behavioral Sciences (MindTap C…
Statistics
ISBN:
9781305504912
Author:
Frederick J Gravetter, Larry B. Wallnau
Publisher:
Cengage Learning

Elementary Statistics: Picturing the World (7th E…
Statistics
ISBN:
9780134683416
Author:
Ron Larson, Betsy Farber
Publisher:
PEARSON

The Basic Practice of Statistics
Statistics
ISBN:
9781319042578
Author:
David S. Moore, William I. Notz, Michael A. Fligner
Publisher:
W. H. Freeman

Introduction to the Practice of Statistics
Statistics
ISBN:
9781319013387
Author:
David S. Moore, George P. McCabe, Bruce A. Craig
Publisher:
W. H. Freeman