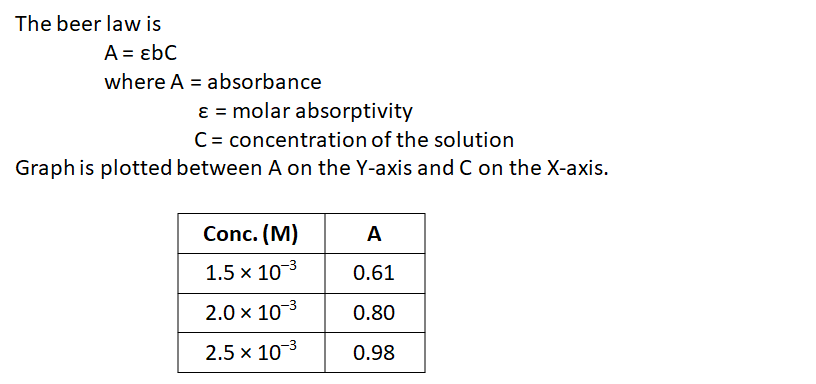
Using the data below, please create a calibration graph and determine the concentration of the unknown sample. Standard #1 Standard #2 Standard #3 Unknown sample Concentration 1.5 x 10³ M 2.0 x 10° M 2.5 x 10 M ? Absorbance 0.61 0.80 0.98 0.72 a) 1.6 x 10 M b) 1.8 x 10 M c) 2.1 x 10³ M d) 2.2 x 10³ M
Using the data below, please create a calibration graph and determine the concentration of the unknown sample. Standard #1 Standard #2 Standard #3 Unknown sample Concentration 1.5 x 10³ M 2.0 x 10° M 2.5 x 10 M ? Absorbance 0.61 0.80 0.98 0.72 a) 1.6 x 10 M b) 1.8 x 10 M c) 2.1 x 10³ M d) 2.2 x 10³ M
Chemistry
10th Edition
ISBN:9781305957404
Author:Steven S. Zumdahl, Susan A. Zumdahl, Donald J. DeCoste
Publisher:Steven S. Zumdahl, Susan A. Zumdahl, Donald J. DeCoste
Chapter1: Chemical Foundations
Section: Chapter Questions
Problem 1RQ: Define and explain the differences between the following terms. a. law and theory b. theory and...
Related questions
Question

Transcribed Image Text:Using the data below, please create a calibration graph and determine the concentration of the unknown sample.
| | Standard #1 | Standard #2 | Standard #3 | Unknown sample |
|-----------------|--------------|--------------|--------------|----------------|
| Concentration | 1.5 x 10^-3 M | 2.0 x 10^-3 M | 2.5 x 10^-3 M | ? |
| Absorbance | 0.61 | 0.80 | 0.98 | 0.72 |
a) 1.6 x 10^-3 M
b) 1.8 x 10^-3 M
c) 2.1 x 10^-3 M
d) 2.2 x 10^-3 M
To determine the concentration of the unknown sample, plot the concentration values of the standards on the x-axis and the absorbance values on the y-axis. Use these points to draw a calibration line. Then, locate the absorbance value of the unknown sample (0.72) on the y-axis and find the corresponding x-axis value to estimate its concentration.
Expert Solution
Step 1

Step by step
Solved in 2 steps with 2 images

Recommended textbooks for you

Chemistry
Chemistry
ISBN:
9781305957404
Author:
Steven S. Zumdahl, Susan A. Zumdahl, Donald J. DeCoste
Publisher:
Cengage Learning

Chemistry
Chemistry
ISBN:
9781259911156
Author:
Raymond Chang Dr., Jason Overby Professor
Publisher:
McGraw-Hill Education

Principles of Instrumental Analysis
Chemistry
ISBN:
9781305577213
Author:
Douglas A. Skoog, F. James Holler, Stanley R. Crouch
Publisher:
Cengage Learning

Chemistry
Chemistry
ISBN:
9781305957404
Author:
Steven S. Zumdahl, Susan A. Zumdahl, Donald J. DeCoste
Publisher:
Cengage Learning

Chemistry
Chemistry
ISBN:
9781259911156
Author:
Raymond Chang Dr., Jason Overby Professor
Publisher:
McGraw-Hill Education

Principles of Instrumental Analysis
Chemistry
ISBN:
9781305577213
Author:
Douglas A. Skoog, F. James Holler, Stanley R. Crouch
Publisher:
Cengage Learning

Organic Chemistry
Chemistry
ISBN:
9780078021558
Author:
Janice Gorzynski Smith Dr.
Publisher:
McGraw-Hill Education

Chemistry: Principles and Reactions
Chemistry
ISBN:
9781305079373
Author:
William L. Masterton, Cecile N. Hurley
Publisher:
Cengage Learning

Elementary Principles of Chemical Processes, Bind…
Chemistry
ISBN:
9781118431221
Author:
Richard M. Felder, Ronald W. Rousseau, Lisa G. Bullard
Publisher:
WILEY