The Widington College program is considering buying a Scanner machine among 5 (five) types, namely the SC1, SC2, SC3, SC4 and SC5 types, where each type has different efficiency in terms of the speed of the number of pages (sheets) scanned in one minute. Six staff members conducted an experiment to run each type of scanner. The following data shows the number of scanned pages (sheets) that can be produced in one minute according to the type of copier, 1 trial, and according to the staff assigned to run each type of scanner: SC 1 SC 2 SC 3 SC 4 SC 5 Staff 1 60 50 63 60 64 Staff 2 56 55 65 58 60 Staff 3 54 56 65 56 58 Staff 4 56 57 67 65 60 Staff 5 54 56 65
Contingency Table
A contingency table can be defined as the visual representation of the relationship between two or more categorical variables that can be evaluated and registered. It is a categorical version of the scatterplot, which is used to investigate the linear relationship between two variables. A contingency table is indeed a type of frequency distribution table that displays two variables at the same time.
Binomial Distribution
Binomial is an algebraic expression of the sum or the difference of two terms. Before knowing about binomial distribution, we must know about the binomial theorem.
The Widington College program is considering buying a Scanner machine among 5 (five) types, namely the SC1, SC2, SC3, SC4 and SC5 types, where each type has different efficiency in terms of the speed of the number of pages (sheets) scanned in one minute. Six staff members conducted an experiment to run each type of scanner. The following data shows the number of scanned pages (sheets) that can be produced in one minute according to the type of copier, 1 trial, and according to the staff assigned to run each type of scanner:
| SC 1 | SC 2 | SC 3 | SC 4 | SC 5 | |
| Staff 1 | 60 | 50 | 63 | 60 | 64 |
| Staff 2 | 56 | 55 | 65 | 58 | 60 |
| Staff 3 | 54 | 56 | 65 | 56 | 58 |
| Staff 4 | 56 | 57 | 67 | 65 | 60 |
| Staff 5 | 54 | 56 | 65 | 60 | 60 |
| Staff 6 | 55 | 52 | 58 | 60 | 55 |
Some of the results of the calculation of the sum of squares (sum-square) and the average squared (mean square) required for the ANOVA test are provided in the following table:
| Source of Variation | SS | Df | MS | F stat | F Table |
| Scanner Machine | 333.3 | ..... | ..... | ..... | ..... |
| Staff | ..... | ..... | ..... | ..... | ..... |
| Error | 129.47 | ..... | ..... | ..... | ..... |
| Total | 532.67 | ..... | ..... | ..... | ..... |
Questions:
a. Fill up the blanks in the table!
b. Next, using the 5 percent significant level, is there a difference in the average efficiency between the 5 (five) types of Scanners?
c. Is there a difference in the average efficiency of the 6 (six) staff?
a)
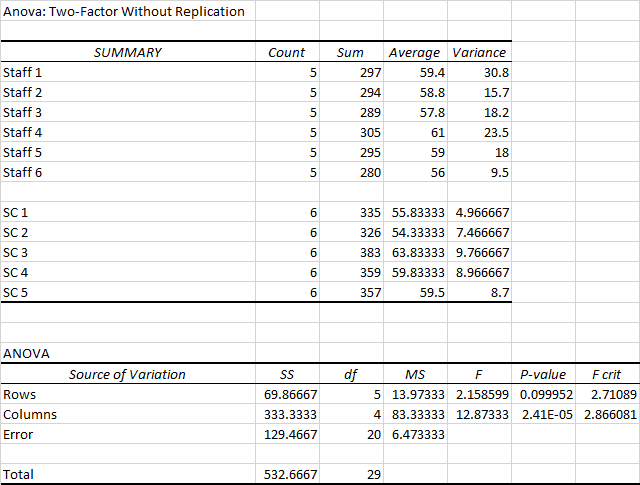
Excel Procedure:
Enter the given data in Excel sheet>Data>Data Analysis>Select ‘Anova: Two factor without Replication’ and click on ‘OK’>Select A1:F7 under ‘input range’>Click on ‘OK’.
Excel Output:

Excel output:

From the output,
| Source of Variation | SS | df | MS | F | F Table |
| staff | 333.3 | 4 | 83.3 | 12.87 | 2.87 |
| Scanner chine | 69.87 | 5 | 13.97 | 2.16 | 2.71 |
| Error | 129.47 | 20 | 6.47 | ||
| Total | 532.67 | 29 |
b)
Null Hypothesis:
H0: There is no difference in the average efficiency between the 5 (five) types of Scanners.
Alternative Hypothesis:
H1: There is a difference in the average efficiency between the 5 (five) types of Scanners.
Decision Rule:
IF test statistic value is greater than the critical value, then reject the null hypothesis.
Conclusion:
Here, the test statistic value(2.16) is less than the critical value(2.71).
Hence, do not reject the null hypothesis.
That is, There is no difference in the average efficiency between the 5 (five) types of Scanners.
Step by step
Solved in 3 steps with 2 images


