The following data represent the plan of a project in Magic Corporation: Times (weeks) Activity A B C D E FGH G I J Predecessor A A A B, C D E, F G a 4 4223 2 1 4 st 1 1 3 1 m 5 4 4 545 m ∞ 3 8 4 2 b 12 12 6 9 5 6 5 9 G H, I a. Draw the network diagram and find the critical path. b. Estimate the expected completion time of the project. c. Calculate the probability that the job will take more than 30 weeks to complete. 11 3

Note:
Since you have posted a question with multiple sub parts, we will provide the solution only to the first three sub parts as per our Q&A guidelines. Please repost the remaining sub parts separately.
Critical path method is project management tool (others e.g WBS, PERT). It uses flow chart of tasks(network /precedence diagram) and helps to find the critical activities of a project in turn help us to find the duration of the project. Project Evaluation and Review Technique-PERT is like CPM but here the activity times are variable (OPTIMISTIC, PESSIMISTIC AND MOST LIKELY). Here we use PERT.
Activity -on -node is a network diagram method that shows the relationship among activities , with each activity being represented on a node
a.
NETWORK DIAGRAM
b
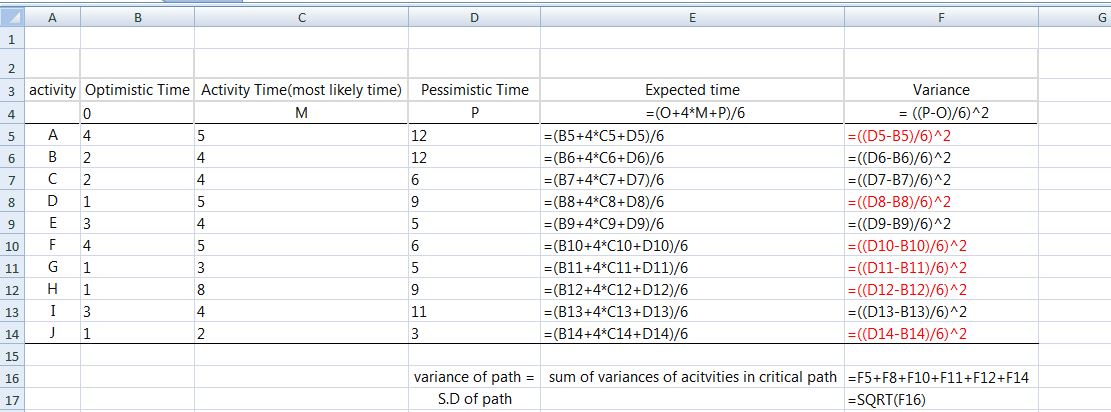
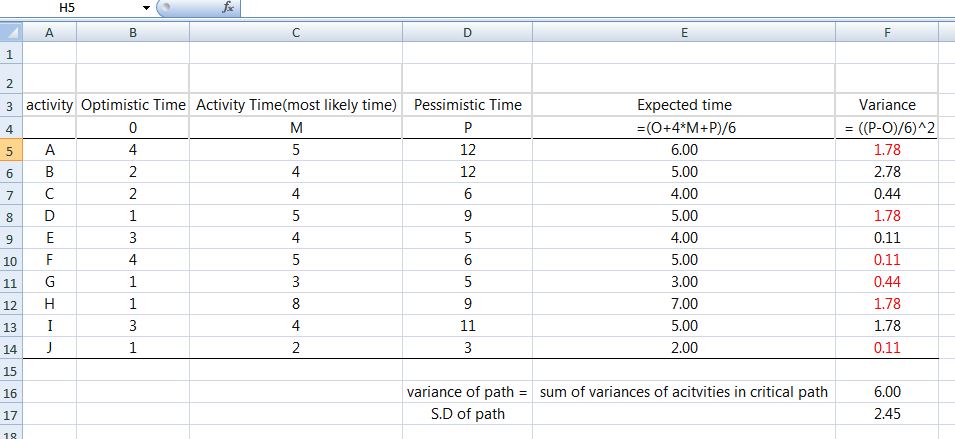
First we find Expected task time of each activity
Expected task time = (optimistic+4* most likely time+ pessimistic time)/6
c
PATH durations:
ACEGHJ= 6+4+4+3+7+2= 26
ACEGIJ= 6+4+4+3+5+2= 24
ABEGHJ= 6+5+4+3+7+2= 27
ABEGIJ= 6+5+4+3+5+2= 25
ADFGHJ= 6+5+5+3+7+2= 28
ADFGIJ= 6+5+5+3+5+2= 26
d
Critical path is the one with longest duration. Here ADFGHJ is the critical path.
Duration of the project depends on the duration of critical path.
e.
Expected compeltion time of project= the duration of critical path. = Project completion time= 28 weeks
Trending now
This is a popular solution!
Step by step
Solved in 3 steps with 4 images


