The diagram below shows the market for phones which have the unfortunate habit of exploding and causing injuries when used. Р 19 16 14 12 10 D. 4 MSB 4 6 10 12 14 16 18 Q a.) What is the efficient quantity for this market? Q = b.) What is the DWL at the market quantity? $ CO 2.
The diagram below shows the market for phones which have the unfortunate habit of exploding and causing injuries when used. Р 19 16 14 12 10 D. 4 MSB 4 6 10 12 14 16 18 Q a.) What is the efficient quantity for this market? Q = b.) What is the DWL at the market quantity? $ CO 2.

Chapter1: Making Economics Decisions
Section: Chapter Questions
Problem 1QTC

Related questions
Question

Transcribed Image Text:## Market Analysis: Exploding Phones
### Diagram Description
The diagram illustrates the market dynamics for phones known to explode and cause injuries. The graph features the following lines:
- **S (Supply Curve)**: An upward sloping line representing how the quantity of phones supplied increases as the price rises.
- **D (Demand Curve)**: A downward sloping line showing how the quantity of phones demanded decreases as the price goes up.
- **MSB (Marginal Social Benefit)**: A line that lies below the demand curve, indicating the social benefit derived from each additional unit of phone.
### Graph Explanation
- The vertical axis (P) represents the price of phones.
- The horizontal axis (Q) represents the quantity of phones.
### Analysis Questions
a.) **Efficient Quantity**: This is the quantity where the MSB and S curves intersect, indicating the socially optimal level of production considering the external costs of injuries.
b.) **Deadweight Loss (DWL) at the Market Quantity**: This value represents the loss in economic efficiency when the equilibrium quantity of phones (where S and D intersect) is higher than the efficient quantity (where S and MSB intersect).
To find the solutions, analyze the intersections of the curves and calculate the areas between the curves at different quantities.
Expert Solution
Step 1
Answer:
(a). The efficient quantity for this market is 8. In the case of negative consumption externality, there will be an external marginal cost that will lower the social marginal benefit. The optimal output will occur where the SMB and S intersect each other. At that point, the quantity is 8.
Efficient quantity = 8
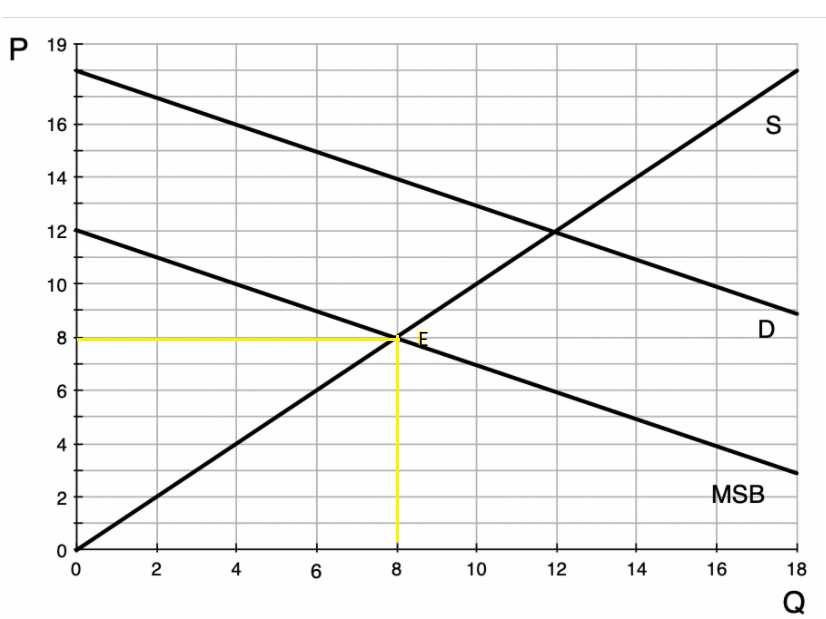
According to the above figure the equilibrium occurs at point E. The corresponding equilibrium quantity is 8.

Step by step
Solved in 2 steps with 2 images

Knowledge Booster


Learn more about
Need a deep-dive on the concept behind this application? Look no further. Learn more about this topic, economics and related others by exploring similar questions and additional content below.Recommended textbooks for you

Principles of Economics (12th Edition)
Economics
ISBN:
9780134078779
Author:
Karl E. Case, Ray C. Fair, Sharon E. Oster
Publisher:
PEARSON

Engineering Economy (17th Edition)
Economics
ISBN:
9780134870069
Author:
William G. Sullivan, Elin M. Wicks, C. Patrick Koelling
Publisher:
PEARSON
Principles of Economics (12th Edition)
Economics
ISBN:
9780134078779
Author:
Karl E. Case, Ray C. Fair, Sharon E. Oster
Publisher:
PEARSON
Engineering Economy (17th Edition)
Economics
ISBN:
9780134870069
Author:
William G. Sullivan, Elin M. Wicks, C. Patrick Koelling
Publisher:
PEARSON

Principles of Economics (MindTap Course List)
Economics
ISBN:
9781305585126
Author:
N. Gregory Mankiw
Publisher:
Cengage Learning

Managerial Economics: A Problem Solving Approach
Economics
ISBN:
9781337106665
Author:
Luke M. Froeb, Brian T. McCann, Michael R. Ward, Mike Shor
Publisher:
Cengage Learning

Managerial Economics & Business Strategy (Mcgraw-…
Economics
ISBN:
9781259290619
Author:
Michael Baye, Jeff Prince
Publisher:
McGraw-Hill Education