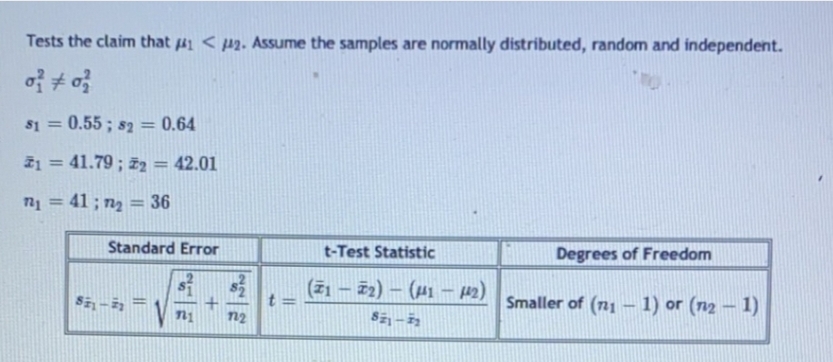
Tests the claim that
Q: -11. Test the clatm that the population means are different. Use level of significance 0.01. sample…
A: Solution: Given information: n1= 49 Sample size of population 1n2= 64 Sample size of population…
Q: the sample variance is greater than 55? Click here to view a table of upper critical values for the…
A: Given n=17 Population mean=100 Variance=20
Q: Random samples of size n were selected from a normal population with the means and variances given…
A: Answer: From the given data, Sample size (n) = 10 Population mean μ = 117 Population variance σ2 = 1…
Q: Suppose x has a distribution with a mean of 70 and a standard deviation of 44. Random samples of…
A: Hey there! Thank you for posting the question. Since your question has more than 3 parts, we are…
Q: The expected duration of a project is 26 weeks and the total project variance allong the critical…
A: Given Data: Let X represent the random variable Mean=26 Var=11.555 X~ Normal (26, 11.555)
Q: Q3: Let i be the observed mean of a random sample of size n from a distribution having mean u and…
A: Hello! As you have posted 2 different questions, we are answering the first question. In case you…
Q: If S₁ and S₂ are the standard deviations of independent random samples of sizes n₁ = 1₂ from normal…
A:
Q: 16 independent normal observations were collected from a population i mean u and known variance o? =…
A: Note: Hi there! Thank you for posting the question. As you have posted multiple questions, as per…
Q: Quantitative data on a variable are collected for two independent groups, with the number of…
A: @solution:: df(Tr)=k-1=4-1=3 df(Error) =N-k=64-4 =60 SST =(n-1)*s2 =63s2 SSE…
Q: X is a normally distributed random variable with mean, µ but unknown variance, o Which of these…
A: From the provided information, X is normally distributed with mean µ and unknown σ2. Sample size is…
Q: · 6.3-5. Let Y₁ < Y2 < ... < Yg be the order statistics of eight independent observations from a…
A: Step 1: Binomial probability: P(X=k)=(kn)∗pk∗(1−p)n−k Step 2: π0.7=27.3n=8This represents that…
Q: This HW reviews the normal distribution, confidence intervals and the central limit theorem. (1)…
A: From the given information, Consider, X be the random variable that follows normal distribution with…
Q: Testing Hu=4, H, : 4with the significance level a=0.05. (0.025=1.96)
A: Suppose that X~N(4,0.12). We have 16 random samples, and the sample mean is 3.92. Significance Level…
Q: -4. Suppose that samples of size n= 25 are selected at ran- dom from a normal population with…
A: Hi! Thank you for the question as per the honour code, we’ll answer the first question since the…
Q: E has been determined experimentally that steel wires of a certain length have strength vith a mean…
A:
Q: Q 2. A Random sample X, X2, .-., X, is drawn from a population that is n(0,0), where 0 > 0. (i) Find…
A: A random sample drawn from Normal population that is Nθ,θ, where θ>0.
Q: Let X1,..., 100 be a random sample from a population with mean 1/2 and variance 1/4. Find…
A: Correct answer is 0.38
Q: of # o} $1 = 0.75; s2 = 0.71 E = 34.08 ; z2 = 34.32 %3D %3D n1 = 23 ; n2 = 32 %3! a. Calculate the…
A: Note: According to bartleby experts question answers guidelines an expert can solve only first three…
Q: t = d¯sdn t = 0.05180.3055145 t = 2.04175 Now lets find p-value Using Excel function ,…
A: The mean difference is 0.0518.
Q: Q2/ (A) Two water samples x and y have given the following statistical results: 50 40 Σ Xị = 300, Yi…
A: It is an important part of statistics. It is widely used.
Q: A population of values has a normal distribution with u random sample of size n = 86. 53.8 and o =…
A: The random variable X follows normal distribution. The population mean is 53.8. The population…
Q: 3) 15 % of the area under the normal curve is between p - 20 and p + 20. ( Round to four decimal…
A:
Q: a The dean of a university estimates that the mean number of classroom hours per week for full-time…
A: a)Null and alternate hypothesis: C. H0:μ=11.0Ha:μ≠11.0
Q: 2 X is a normally distributed random variable with mean, u but unknown variance, o Which of these…
A: Solution-: X is a normally distributed variable with mean, μ but unknown variance σ2. Which of the…
Q: Assume that z-scores are normally distr If P( – b < z < b) = 0.4488, find b.
A:
Q: A random sample of size n = 16 is drawn from a normal population with a variance of 16, what is the…
A: Given that n=sample size= 16 sample variance= 16 So standard deviation=s= √16= 4 Confidence level…
Q: Assume that you have a sample of n, =4, with the sample mean X, =44, and a sample standard deviation…
A: The significance level, α=0.01 Sample 1 Sample 2 Sample size n1=4 n2=7 Sample mean x1=44…
Q: Parent population (can be changed with the mouse) 16.00 16.00 5.00 mea mediam- Clea Nom akew=…
A: The sampling distribution of mean will follow normal distribution by central limit theorem for large…
Q: Tests the claim that #1 # p2. Assume the samples are normally distributed, random and independent.…
A: Solution
Q: You wish to test the following claim (H.) at a significance level of a = 0.005. Ho:P1 P2 Ha: Pi P2 =…
A:
Q: Standard error of the mean. A random sample from a certain population has I = -44.6, s = 6.02, and n…
A: Solution: Note: Hello! As you have posted more than 3 sub parts, we are answering the first 3…
Q: size 15 from a population with unknown variance Test the hypothesis How S16, H, µ> 16 use a = 0.10…
A: The difference between two means is used to compare means of two groups when sample of size n<30.…
Q: None
A: Part 1: Upper 95% Bound for the Mean Reaction Time1. Understanding the Problem:We are given data…
Q: 6.4-2. A random sample X₁, X2,..., Xn of size n is taken from N(μ, o²), where the variance 0 = o² is…
A:
Q: Determine the mean, E(X), and variance, V(X). Ro
A:
Q: Question 13: Calculate the value of Uz that corresponds to 19.39, le- 19.18 and o- 4. If I draw a…
A: Question 2: Given Information: Sample size n=3Mean μ=10t score fall in the interval ±2
Q: Consider a sample X,,X,,X¸of normally distributed random variables with mean u. Suppose that n = 11.…
A: Given : n=11 Sample standard deviation S is given hence we use t test. Degrees of freedom (df):…
Given data:
Step by step
Solved in 3 steps with 3 images
- True False 1.4 From the t-distribution table we can find values -ta, and ta, so that: P(-ta,11Q1: Lifetimes of a certain component are lognormally distributed with parameters u = 1 day and o = 0.5 days. Find the mean lifetime of these components. 1-Find the standard deviation of the lifetimes. 2-Find CDF 3- Find reliability at t= 4 day Q2: The lifetime (in days) of a certain electronic component that operates in a high-temperature environment is lognormally distributed with u = 1.2 and o = 2. a. Find the mean lifetime. b. Find the probability that a component lasts between three and six days. c. Find the 95th percentile of the lifetimes. d- find CDF Q3: The authors suggest using a Weibull distribution to model the duration of a bake step in the manufacture of a semiconductor. Let T represent the duration in hours of the bake step for a randomly chosen lot. If T Weibull(0.3, 0.1), what is the probability that the bake step takes longer than four hours? What is the probability that it takes between two and seven hours? What reliability at t= 0.8 hoursTests the claim that 1 # p2. Assume the samples are normally distributed, random and independent. of + o S1 =0.77 ; s2 = 0.82 E1 = 48.92 ; z2 = 48.94 n1 = 24; n2 = 31 a. Calculate the Standard Error s-, = (use 3 decimal places) (use 2 decimal places) b. Calculate the t-test statistic using the standard error from part a. t = c. What are the degrees of freedom? df %3! d. At a = 0.02, Use the distribution table to find the critical values for the rejection region t = ± (use 4 decimal places) e. What is your conclusion? O Fail to reject the null hypothesis and do not support the claim O Reject the alternative hypothesis and support the claim O Accept the null hypothesis and support the claim O Reject the null hypothesis and support the claim O Accept the alternative hypothesis and reject the claime this K 23-2....xlsx ^ Assume that you have a sample of n₁ = 7, with the sample mean X₁ = 43, and a sample standard deviation of S₁ = 5, and you have an independent sample of n₂ = 16 from another population with a sample mean of X₂ = 31, and the sample standard deviation S₂ = 8. Construct a 90% confidence interval estimate of the population mean difference between ₁ and μ2. Assume that the two population variances are equal. ₁-₂ (Round to two decimal places as needed.) View an example Get more help. data-2_13_2023-2....xlsx ^ ... (0,0) Clear all More- Check answer Show all X ►NoneAn individual who has automobile insurance from acertain company is randomly selected. Let Y be thenumber of moving violations for which the individualwas cited during the last 3 years. The pmf of Y is y p(y) 0 0.6 0.25 0.10 0.05 2 4 6 Suppose an individual with Y violations incurs a surcharge of $100. Calculate the standard deviation of the surcharge Y. 1.48 1.72 2.2 1.2Pls solve it quickly..J Suppose that Shoe Sices Of American women have a bell Shaped elu standard with a mean of 8,37 and a eleviation of 1.49, using the empirical Rule what percentage of american women have Shoe Sizes that are no more than 9.su? do not Roundl your answerProb & Stat 1Q2: Let X and Y have a bivariate normal distribution with parameters 4, = 2 = 1, of = 16, af = 25 and p = 3. The value of P(-3Xen distributed with mean 2 но I and variance fo.1, then jud P(|X-21) 20.0 Q.3. @ 1 A random sample large bad fou for the in the. بالمسم < Me 500 apples courgument, and 160 95%. Conf percentage number consiguement. Taken was from 60, were to bei dence inteural had apples ofSEE MORE QUESTIONSRecommended textbooks for youMATLAB: An Introduction with ApplicationsStatisticsISBN:9781119256830Author:Amos GilatPublisher:John Wiley & Sons IncProbability and Statistics for Engineering and th…StatisticsISBN:9781305251809Author:Jay L. DevorePublisher:Cengage LearningStatistics for The Behavioral Sciences (MindTap C…StatisticsISBN:9781305504912Author:Frederick J Gravetter, Larry B. WallnauPublisher:Cengage LearningElementary Statistics: Picturing the World (7th E…StatisticsISBN:9780134683416Author:Ron Larson, Betsy FarberPublisher:PEARSONThe Basic Practice of StatisticsStatisticsISBN:9781319042578Author:David S. Moore, William I. Notz, Michael A. FlignerPublisher:W. H. FreemanIntroduction to the Practice of StatisticsStatisticsISBN:9781319013387Author:David S. Moore, George P. McCabe, Bruce A. CraigPublisher:W. H. FreemanMATLAB: An Introduction with ApplicationsStatisticsISBN:9781119256830Author:Amos GilatPublisher:John Wiley & Sons IncProbability and Statistics for Engineering and th…StatisticsISBN:9781305251809Author:Jay L. DevorePublisher:Cengage LearningStatistics for The Behavioral Sciences (MindTap C…StatisticsISBN:9781305504912Author:Frederick J Gravetter, Larry B. WallnauPublisher:Cengage LearningElementary Statistics: Picturing the World (7th E…StatisticsISBN:9780134683416Author:Ron Larson, Betsy FarberPublisher:PEARSONThe Basic Practice of StatisticsStatisticsISBN:9781319042578Author:David S. Moore, William I. Notz, Michael A. FlignerPublisher:W. H. FreemanIntroduction to the Practice of StatisticsStatisticsISBN:9781319013387Author:David S. Moore, George P. McCabe, Bruce A. CraigPublisher:W. H. Freeman