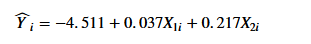
Profitability remains a challenge for banks and thrifts with less than $2 billion of assets. The business problem facing a bank analyst relates to the factors that affect return on average assets (ROAA), an indicator of how profitable a company is relative to its total assets. Data collected from a sample of 20 community banks resulted in the regression model Y₁ = -4.511 +0.037X₁ +0.217X2, where Y is the ROAA (%), X₁ is the efficiency ratio (%), and X₂ is the total risk-based capital (%). Complete parts (a) through (d) below. b. Plot the residuals versus X₁₁. Choose the correct graph below. O A. Q B. Q D. Q
Profitability remains a challenge for banks and thrifts with less than $2 billion of assets. The business problem facing a bank analyst relates to the factors that affect return on average assets (ROAA), an indicator of how profitable a company is relative to its total assets. Data collected from a sample of 20 community banks resulted in the regression model Y₁ = -4.511 +0.037X₁ +0.217X2, where Y is the ROAA (%), X₁ is the efficiency ratio (%), and X₂ is the total risk-based capital (%). Complete parts (a) through (d) below. b. Plot the residuals versus X₁₁. Choose the correct graph below. O A. Q B. Q D. Q

MATLAB: An Introduction with Applications
6th Edition
ISBN:9781119256830
Author:Amos Gilat
Publisher:Amos Gilat
Chapter1: Starting With Matlab
Section: Chapter Questions
Problem 1P

Related questions
Question

Transcribed Image Text:The table below presents financial metrics, including Return on Average Assets (ROAA), Efficiency Ratio, and Total Risk-Based Capital for various entities. These metrics are critical for assessing the financial health and performance of institutions. The ROAA (%) indicates how efficient a company is at using its assets to generate earnings. A higher ROAA suggests better performance. The Efficiency Ratio (%) reflects how well a company manages its expenses; lower values are preferred as they indicate better efficiency. Total Risk-Based Capital (%) evaluates the capital adequacy, ensuring the financial stability of the institution.
| ROAA (%) | Efficiency Ratio (%) | Total Risk-Based Capital (%) |
|----------|----------------------|------------------------------|
| 1.04 | 39.93 | 17.04 |
| 0.68 | 57.75 | 13.88 |
| 7.27 | 81.4 | 27.77 |
| 1.08 | 53.49 | 18.31 |
| 0.72 | 71.08 | 14.66 |
| 0.92 | 65.41 | 14.04 |
| 0.79 | 68.07 | 13.38 |
| 1.04 | 68.14 | 16.8 |
| 1.76 | 68.1 | 16.69 |
| 1.07 | 64.82 | 13.86 |
| 1.37 | 48.58 | 12 |
| 0.93 | 63.1 | 18.65 |
| 0.66 | 59.16 | 19.76 |
| 1.72 | 49.93 | 17.69 |
| 1.5 | 54.7 | 26.6 |
| 0.59 | 81.6 | 15.08 |
| 2.12 | 75.21 | 14.55 |
| 1.11 | 69.82 | 17.5 |
| 1.45 | 49.47 | 16.03 |
| 1.06 |
![**Understanding Bank Profitability in Relation to ROAA**
Profitability remains a challenge for banks and thrifts with less than $2 billion of assets. The main question for bank analysts is what factors affect the return on average assets (ROAA), an important measure of how profitable a company is in relation to its total assets. Here, data was collected from a sample of 20 community banks leading to the development of a specific regression model:
\[
\hat{Y} = -4.511 + 0.037X_{1i} + 0.217X_{2i}
\]
Where:
- \( Y \) = ROAA (%)
- \( X_1 \) = Efficiency ratio (%)
- \( X_2 \) = Total risk-based capital (%)
**Instructions:**
Complete the following steps to analyze the data:
**b. Plot the Residuals versus \( X_{1i} \). Choose the correct graph below:**
You are provided with four graphs labeled A, B, C, and D. Each graph plots the residuals against \( X_1 \) (Efficiency ratio), ranging from 25 to 100 on the \( X \)-axis, while the \( Y \)-axis represents the residuals ranging from -3 to 3. Select the graph that correctly displays the data distribution.
**c. Plot the Residuals versus \( X_{2i} \). Choose the correct graph below:**
Select the graph that accurately represents residuals plotted against \( X_2 \) (Total risk-based capital). Similar to the previous graphs, choose the one that reflects the correct pattern of data.](/v2/_next/image?url=https%3A%2F%2Fcontent.bartleby.com%2Fqna-images%2Fquestion%2Fc91d435c-8a20-4fa9-b80f-5aaeb9e13244%2F0e714288-f608-4486-b58f-b1f867644bd3%2Fzgx837_processed.png&w=3840&q=75)
Transcribed Image Text:**Understanding Bank Profitability in Relation to ROAA**
Profitability remains a challenge for banks and thrifts with less than $2 billion of assets. The main question for bank analysts is what factors affect the return on average assets (ROAA), an important measure of how profitable a company is in relation to its total assets. Here, data was collected from a sample of 20 community banks leading to the development of a specific regression model:
\[
\hat{Y} = -4.511 + 0.037X_{1i} + 0.217X_{2i}
\]
Where:
- \( Y \) = ROAA (%)
- \( X_1 \) = Efficiency ratio (%)
- \( X_2 \) = Total risk-based capital (%)
**Instructions:**
Complete the following steps to analyze the data:
**b. Plot the Residuals versus \( X_{1i} \). Choose the correct graph below:**
You are provided with four graphs labeled A, B, C, and D. Each graph plots the residuals against \( X_1 \) (Efficiency ratio), ranging from 25 to 100 on the \( X \)-axis, while the \( Y \)-axis represents the residuals ranging from -3 to 3. Select the graph that correctly displays the data distribution.
**c. Plot the Residuals versus \( X_{2i} \). Choose the correct graph below:**
Select the graph that accurately represents residuals plotted against \( X_2 \) (Total risk-based capital). Similar to the previous graphs, choose the one that reflects the correct pattern of data.
Expert Solution
Step 1
Given regression equation is,
| Y | X1 | X2 | |
Residual=Y−Yˆ |
| 1.04-0.66409=0.37591 | ||||
| 0.68 | 57.75 | 13.88 | 0.63771 | 0.04229 |
| 7.27 | 81.4 | 27.77 | 4.52689 | 2.74311 |
| 1.08 | 53.49 | 18.31 | 1.4414 | -0.3614 |
| 0.72 | 71.08 | 14.66 | 1.30018 | -0.58018 |
| 0.92 | 65.41 | 14.04 | 0.95585 | -0.03585 |
| 0.79 | 68.07 | 13.38 | 0.91105 | -0.12105 |
| 1.04 | 68.14 | 16.8 | 1.65578 | -0.61578 |
| 1.76 | 68.1 | 16.69 | 1.63043 | 0.12957 |
| 1.07 | 64.82 | 13.86 | 0.89496 | 0.17504 |
| 1.37 | 48.58 | 12 | -0.10954 | 1.47954 |
| 0.93 | 63.1 | 18.65 | 1.87075 | -0.94075 |
| 0.66 | 59.16 | 19.76 | 1.96584 | -1.30584 |
| 1.72 | 49.93 | 17.69 | 1.17514 | 0.54486 |
| 1.5 | 54.7 | 26.6 | 3.2851 | -1.7851 |
| 0.59 | 81.6 | 15.08 | 1.78056 | -1.19056 |
| 2.12 | 75.21 | 14.55 | 1.42912 | 0.69088 |
| 1.11 | 69.82 | 17.5 | 1.86984 | -0.75984 |
| 1.45 | 49.47 | 16.03 | 0.7979 | 0.6521 |
| 1.06 | 57.09 | 14.62 | 0.77387 | 0.28613 |

Step by step
Solved in 3 steps with 4 images

Recommended textbooks for you
MATLAB: An Introduction with Applications
Statistics
ISBN:
9781119256830
Author:
Amos Gilat
Publisher:
John Wiley & Sons Inc

Probability and Statistics for Engineering and th…
Statistics
ISBN:
9781305251809
Author:
Jay L. Devore
Publisher:
Cengage Learning

Statistics for The Behavioral Sciences (MindTap C…
Statistics
ISBN:
9781305504912
Author:
Frederick J Gravetter, Larry B. Wallnau
Publisher:
Cengage Learning
MATLAB: An Introduction with Applications
Statistics
ISBN:
9781119256830
Author:
Amos Gilat
Publisher:
John Wiley & Sons Inc
Probability and Statistics for Engineering and th…
Statistics
ISBN:
9781305251809
Author:
Jay L. Devore
Publisher:
Cengage Learning
Statistics for The Behavioral Sciences (MindTap C…
Statistics
ISBN:
9781305504912
Author:
Frederick J Gravetter, Larry B. Wallnau
Publisher:
Cengage Learning

Elementary Statistics: Picturing the World (7th E…
Statistics
ISBN:
9780134683416
Author:
Ron Larson, Betsy Farber
Publisher:
PEARSON

The Basic Practice of Statistics
Statistics
ISBN:
9781319042578
Author:
David S. Moore, William I. Notz, Michael A. Fligner
Publisher:
W. H. Freeman

Introduction to the Practice of Statistics
Statistics
ISBN:
9781319013387
Author:
David S. Moore, George P. McCabe, Bruce A. Craig
Publisher:
W. H. Freeman