) Produce an appropriate fully labelled chart to reflect the quarterly totals for each region. b) Use a suitable and fully labelled chart to reflect the contr
) Produce an appropriate fully labelled chart to reflect the quarterly totals for each region. b) Use a suitable and fully labelled chart to reflect the contr

MATLAB: An Introduction with Applications
6th Edition
ISBN:9781119256830
Author:Amos Gilat
Publisher:Amos Gilat
Chapter1: Starting With Matlab
Section: Chapter Questions
Problem 1P

Related questions
Question
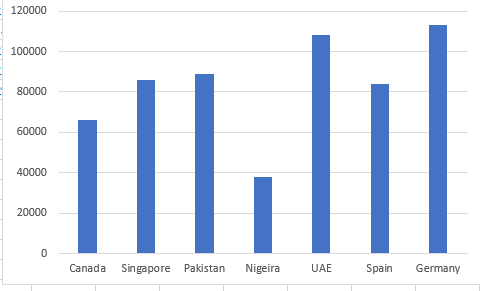
a) Produce an appropriate fully labelled chart to reflect the quarterly totals for each region.
b) Use a suitable and fully labelled chart to reflect the contribution of each region to the overall project annual revenue.

Transcribed Image Text:123
4
5
6
7
8
9
10
11
A
B
с
Nigeria
UAE
Country
Q1
Canada 15000
Singapore 20000
Pakistan
25000
10000
27000
Spain
19000
Germany 26000
D
AllTech Group
Forecasted Global Revenue Dashboard for 2021
Q3
18000
22000
22000
11000
28000
21000
30000
E
Q2
16000
23000
21000
9000
26000
22000
28000
F
Q4
17000
21000
21000
8000
27000
22000
29000
Expert Solution
Step 1
a)
From the given information,
| Country | Q1 | Q2 | Q3 | Q4 | Totals |
| Canada | 15000 | 16000 | 18000 | 17000 | 66000 |
| Singapore | 20000 | 23000 | 22000 | 21000 | 86000 |
| Pakistan | 25000 | 21000 | 22000 | 21000 | 89000 |
| Nigeria | 10000 | 9000 | 11000 | 8000 | 38000 |
| UAE | 27000 | 26000 | 28000 | 27000 | 108000 |
| Spain | 19000 | 22000 | 21000 | 22000 | 84000 |
| Germany | 26000 | 28000 | 30000 | 29000 | 113000 |
Chart for the totals for the countries:
Excel Procedure:
- Enter the columns of country and totals in Excel.
- Select the data in excel.
- Go to insert.
- Go to insert column or Bar chart.
- click on 2-D cluster column.
Excel Output:

Step by step
Solved in 2 steps with 2 images

Recommended textbooks for you
MATLAB: An Introduction with Applications
Statistics
ISBN:
9781119256830
Author:
Amos Gilat
Publisher:
John Wiley & Sons Inc

Probability and Statistics for Engineering and th…
Statistics
ISBN:
9781305251809
Author:
Jay L. Devore
Publisher:
Cengage Learning

Statistics for The Behavioral Sciences (MindTap C…
Statistics
ISBN:
9781305504912
Author:
Frederick J Gravetter, Larry B. Wallnau
Publisher:
Cengage Learning
MATLAB: An Introduction with Applications
Statistics
ISBN:
9781119256830
Author:
Amos Gilat
Publisher:
John Wiley & Sons Inc
Probability and Statistics for Engineering and th…
Statistics
ISBN:
9781305251809
Author:
Jay L. Devore
Publisher:
Cengage Learning
Statistics for The Behavioral Sciences (MindTap C…
Statistics
ISBN:
9781305504912
Author:
Frederick J Gravetter, Larry B. Wallnau
Publisher:
Cengage Learning

Elementary Statistics: Picturing the World (7th E…
Statistics
ISBN:
9780134683416
Author:
Ron Larson, Betsy Farber
Publisher:
PEARSON

The Basic Practice of Statistics
Statistics
ISBN:
9781319042578
Author:
David S. Moore, William I. Notz, Michael A. Fligner
Publisher:
W. H. Freeman

Introduction to the Practice of Statistics
Statistics
ISBN:
9781319013387
Author:
David S. Moore, George P. McCabe, Bruce A. Craig
Publisher:
W. H. Freeman