Popular Diets. In the article “Comparison of the Atkins, Ornish, Weight Watchers, and Zone Diets for Weight Loss and Heart Disease Risk Reduction” (Journal of the American Medical Association, Vol. 293, No. 1, pp. 43–53), M. Dansinger et al. conducted a randomized trial to assess the effectiveness of four popular diets for weight loss. Overweight adults with average body mass index of 35 and ages 22–72 years participated in the randomized trial for 1 year. The weight losses, in kilograms, based on the results of the experiment are given on the WeissStats site. Negative losses are gains. WW = Weight Watchers. a. Obtain individual normal probability plots and the standard deviations of the samples. b. Perform a residual analysis. c. Use your results from parts (a) and (b) to decide whether conducting a one-way ANOVA test on the data is reasonable. If so, also do parts (d) and (e). d. Use a one-way ANOVA test to decide, at the 5% significance level, whether the data provide sufficient evidence to conclude that a difference exists among the means of the populations from which the samples were taken. e. Interpret your results from part (d)
Popular Diets. In the article “Comparison of the Atkins, Ornish, Weight Watchers, and Zone Diets for Weight Loss and Heart Disease Risk Reduction” (Journal of the American Medical Association, Vol. 293, No. 1, pp. 43–53), M. Dansinger et al. conducted a randomized trial to assess the effectiveness of four popular diets for weight loss. Overweight adults with average body mass index of 35 and ages 22–72 years participated in the randomized trial for 1 year. The weight losses, in kilograms, based on the results of the experiment are given on the WeissStats site. Negative losses are gains. WW = Weight Watchers.
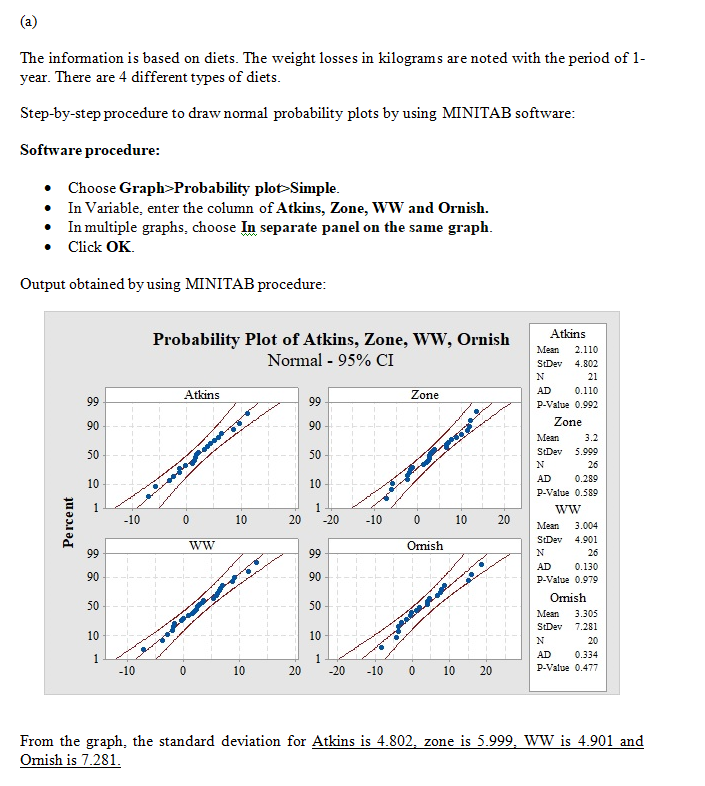
a. Obtain individual normal probability plots and the standard deviations of the samples.
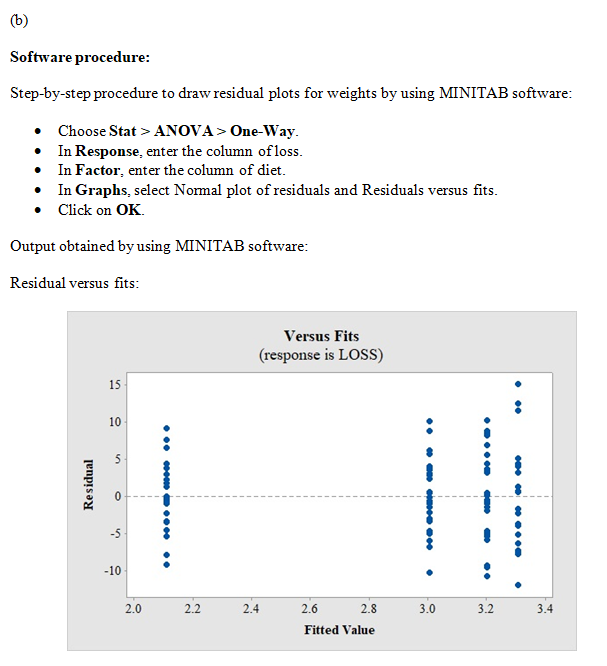
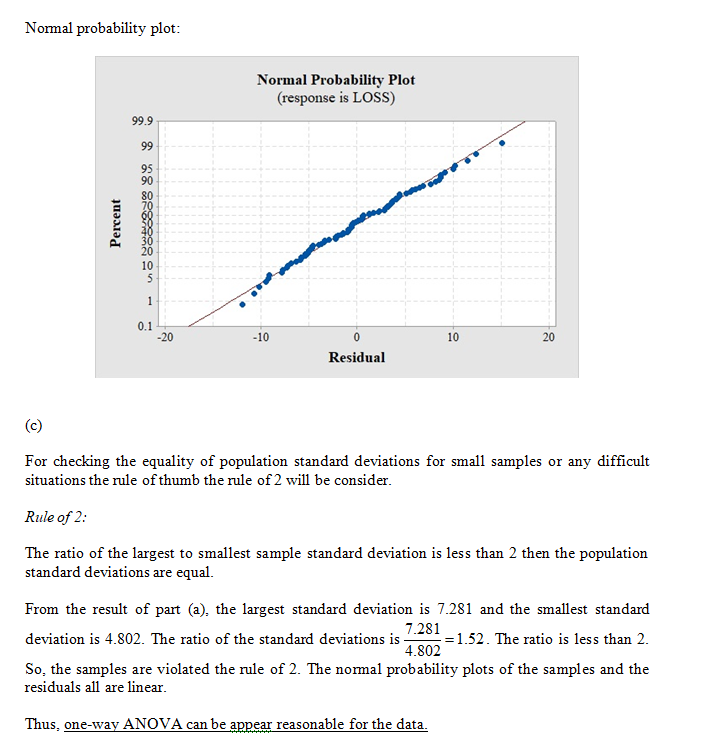
b. Perform a residual analysis.
c. Use your results from parts (a) and (b) to decide whether conducting a one-way ANOVA test on the data is reasonable. If so, also do parts (d) and (e).
d. Use a one-way ANOVA test to decide, at the 5% significance level, whether the data provide sufficient evidence to conclude that a difference exists among the means of the populations from which the samples were taken.
e. Interpret your results from part (d)


Step by step
Solved in 2 steps with 5 images


