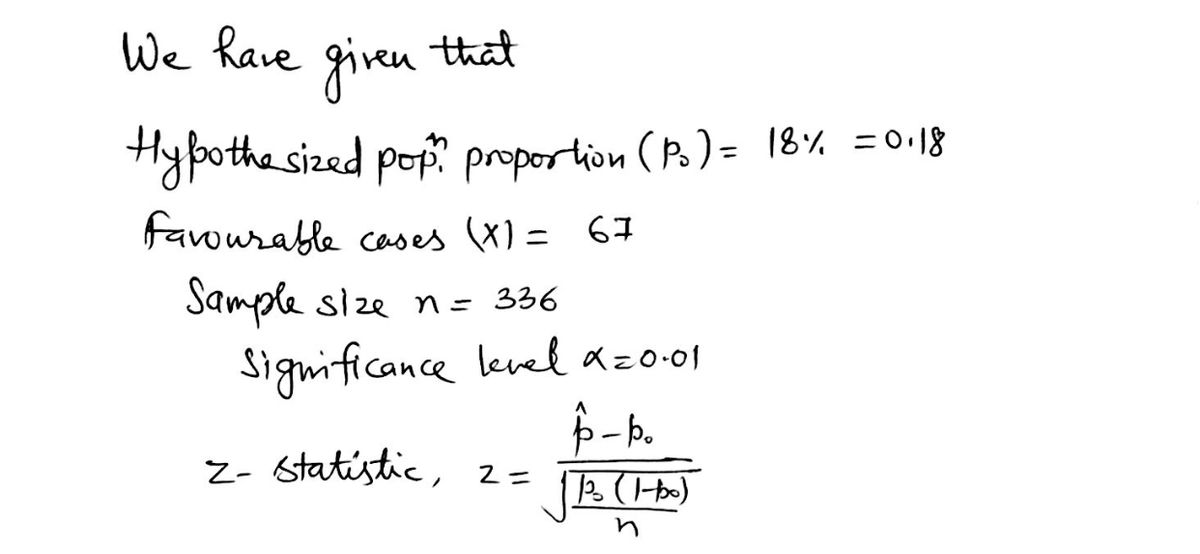
larger for students receiving financial aid? Of the 336 randomly selected students who receive financial aid, 67 of them volunteered their time. What can be concluded at the a = 0.01 level of significance? a. For this study, we should use Select an answer b. The null and alternative hypotheses would be: Ho: ?v Select an answer v (please enter a decimal) H1: Select an answer v (Please enter a decimal) c. The test statistic ? v = (please show your answer to 3 decimal places.) d. The p-value = (Please show your answer to 4 decimal places.) e. The p-value is ? v a f. Based on this, we should Select an answer v the null hypothesis. g. Thus, the final conclusion is that ... O The data suggest the population proportion is not significantly higher than 18% at a = 0.01, so there is sufficient evidence to conclude that the percentage of financial aid recipients who volunteer is equal to 18%. O The data suggest the population proportion is not significantly higher than 18% at a = 0.01, so there is insufficient evidence to conclude that the percentage of financial aid recipients who volunteer is higher than 18%. O The data suggest the populaton proportion is significantly higher than 18% at a = 0.01, so there is sufficient evidence to conclude that the percentage of financial aid recipients who volunteer is higher than 18%.
larger for students receiving financial aid? Of the 336 randomly selected students who receive financial aid, 67 of them volunteered their time. What can be concluded at the a = 0.01 level of significance? a. For this study, we should use Select an answer b. The null and alternative hypotheses would be: Ho: ?v Select an answer v (please enter a decimal) H1: Select an answer v (Please enter a decimal) c. The test statistic ? v = (please show your answer to 3 decimal places.) d. The p-value = (Please show your answer to 4 decimal places.) e. The p-value is ? v a f. Based on this, we should Select an answer v the null hypothesis. g. Thus, the final conclusion is that ... O The data suggest the population proportion is not significantly higher than 18% at a = 0.01, so there is sufficient evidence to conclude that the percentage of financial aid recipients who volunteer is equal to 18%. O The data suggest the population proportion is not significantly higher than 18% at a = 0.01, so there is insufficient evidence to conclude that the percentage of financial aid recipients who volunteer is higher than 18%. O The data suggest the populaton proportion is significantly higher than 18% at a = 0.01, so there is sufficient evidence to conclude that the percentage of financial aid recipients who volunteer is higher than 18%.

MATLAB: An Introduction with Applications
6th Edition
ISBN:9781119256830
Author:Amos Gilat
Publisher:Amos Gilat
Chapter1: Starting With Matlab
Section: Chapter Questions
Problem 1P

Related questions
Question
100%
![18% of all college students volunteer their time. Is the percentage of college students who are volunteers larger for students receiving financial aid? Of the 336 randomly selected students who receive financial aid, 67 of them volunteered their time. What can be concluded at the α = 0.01 level of significance?
a. For this study, we should use [Select an answer]
b. The null and alternative hypotheses would be:
\( H_0: \) [Select an answer] [Please enter a decimal]
\( H_1: \) [Select an answer] [Please enter a decimal]
c. The test statistic \( ? = \) [please show your answer to 3 decimal places.]
d. The p-value = [Please show your answer to 4 decimal places.]
e. The p-value is [Select an answer] α
f. Based on this, we should [Select an answer] the null hypothesis.
g. Thus, the final conclusion is that …
- \( \circ \) The data suggest the population proportion is not significantly higher than 18% at α = 0.01, so there is sufficient evidence to conclude that the percentage of financial aid recipients who volunteer is equal to 18%.
- \( \circ \) The data suggest the population proportion is not significantly higher than 18% at α = 0.01, so there is insufficient evidence to conclude that the percentage of financial aid recipients who volunteer is higher than 18%.
- \( \circ \) The data suggest the population proportion is significantly higher than 18% at α = 0.01, so there is sufficient evidence to conclude that the percentage of financial aid recipients who volunteer is higher than 18%.](/v2/_next/image?url=https%3A%2F%2Fcontent.bartleby.com%2Fqna-images%2Fquestion%2F64061994-5f1c-449d-8fb6-0cc2c5134779%2F585bf2f3-40b2-493c-8033-8e711e592dbf%2F6hbzsq_processed.png&w=3840&q=75)
Transcribed Image Text:18% of all college students volunteer their time. Is the percentage of college students who are volunteers larger for students receiving financial aid? Of the 336 randomly selected students who receive financial aid, 67 of them volunteered their time. What can be concluded at the α = 0.01 level of significance?
a. For this study, we should use [Select an answer]
b. The null and alternative hypotheses would be:
\( H_0: \) [Select an answer] [Please enter a decimal]
\( H_1: \) [Select an answer] [Please enter a decimal]
c. The test statistic \( ? = \) [please show your answer to 3 decimal places.]
d. The p-value = [Please show your answer to 4 decimal places.]
e. The p-value is [Select an answer] α
f. Based on this, we should [Select an answer] the null hypothesis.
g. Thus, the final conclusion is that …
- \( \circ \) The data suggest the population proportion is not significantly higher than 18% at α = 0.01, so there is sufficient evidence to conclude that the percentage of financial aid recipients who volunteer is equal to 18%.
- \( \circ \) The data suggest the population proportion is not significantly higher than 18% at α = 0.01, so there is insufficient evidence to conclude that the percentage of financial aid recipients who volunteer is higher than 18%.
- \( \circ \) The data suggest the population proportion is significantly higher than 18% at α = 0.01, so there is sufficient evidence to conclude that the percentage of financial aid recipients who volunteer is higher than 18%.
Expert Solution
Step 1

Step by step
Solved in 2 steps with 2 images

Recommended textbooks for you
MATLAB: An Introduction with Applications
Statistics
ISBN:
9781119256830
Author:
Amos Gilat
Publisher:
John Wiley & Sons Inc

Probability and Statistics for Engineering and th…
Statistics
ISBN:
9781305251809
Author:
Jay L. Devore
Publisher:
Cengage Learning

Statistics for The Behavioral Sciences (MindTap C…
Statistics
ISBN:
9781305504912
Author:
Frederick J Gravetter, Larry B. Wallnau
Publisher:
Cengage Learning
MATLAB: An Introduction with Applications
Statistics
ISBN:
9781119256830
Author:
Amos Gilat
Publisher:
John Wiley & Sons Inc
Probability and Statistics for Engineering and th…
Statistics
ISBN:
9781305251809
Author:
Jay L. Devore
Publisher:
Cengage Learning
Statistics for The Behavioral Sciences (MindTap C…
Statistics
ISBN:
9781305504912
Author:
Frederick J Gravetter, Larry B. Wallnau
Publisher:
Cengage Learning

Elementary Statistics: Picturing the World (7th E…
Statistics
ISBN:
9780134683416
Author:
Ron Larson, Betsy Farber
Publisher:
PEARSON

The Basic Practice of Statistics
Statistics
ISBN:
9781319042578
Author:
David S. Moore, William I. Notz, Michael A. Fligner
Publisher:
W. H. Freeman

Introduction to the Practice of Statistics
Statistics
ISBN:
9781319013387
Author:
David S. Moore, George P. McCabe, Bruce A. Craig
Publisher:
W. H. Freeman