For the following tests of hypothese, assume we calculated the test statistic and found the rejection region. i) Setup the hypotheses; i) Find the significance levela of the test; i) Graph and calculatelestimate the P-value; iv) State your conclusion for the test. Test statistic z= 2.03; Rejection Region : z> 1.28 i) Choose the correct hypotheses O A. Ho: H = Ho Vs HA: H+ Ho O B. Ho: = Ho vs HA: H < Ho OC. Hoi u > Ho vs HA u = Ho O D. Ho: u = Ho vs Hạ: u> Ho i) Significance level a =(Keep two digits after decimal point) lii) Which of the following shaded area represent the p-value of this test? OA. OB. -3 -2 -1 0 1 2 3 -3 -2 -1 0 1 2 3 OD. -3 -2 -1 0 1 2 3 -3 -2 -1 0 1 2 3 Calculate P-value: P-value =(Keep four digits after decimal point) iv) Choose All of the correct statements from the following: O Do not reject H, since p-value a O Do not reject H, since z is not in the rejection region O Reject H, since p-value < a O Reject Ho since p-value > a O Reject Ho since z is in the rejection region
For the following tests of hypothese, assume we calculated the test statistic and found the rejection region. i) Setup the hypotheses; i) Find the significance levela of the test; i) Graph and calculatelestimate the P-value; iv) State your conclusion for the test. Test statistic z= 2.03; Rejection Region : z> 1.28 i) Choose the correct hypotheses O A. Ho: H = Ho Vs HA: H+ Ho O B. Ho: = Ho vs HA: H < Ho OC. Hoi u > Ho vs HA u = Ho O D. Ho: u = Ho vs Hạ: u> Ho i) Significance level a =(Keep two digits after decimal point) lii) Which of the following shaded area represent the p-value of this test? OA. OB. -3 -2 -1 0 1 2 3 -3 -2 -1 0 1 2 3 OD. -3 -2 -1 0 1 2 3 -3 -2 -1 0 1 2 3 Calculate P-value: P-value =(Keep four digits after decimal point) iv) Choose All of the correct statements from the following: O Do not reject H, since p-value a O Do not reject H, since z is not in the rejection region O Reject H, since p-value < a O Reject Ho since p-value > a O Reject Ho since z is in the rejection region

MATLAB: An Introduction with Applications
6th Edition
ISBN:9781119256830
Author:Amos Gilat
Publisher:Amos Gilat
Chapter1: Starting With Matlab
Section: Chapter Questions
Problem 1P

Related questions
Question

Transcribed Image Text:For the following tests of hypothese, assume we calculated the test statistic and found the rejection region. i) Setup the hypotheses;
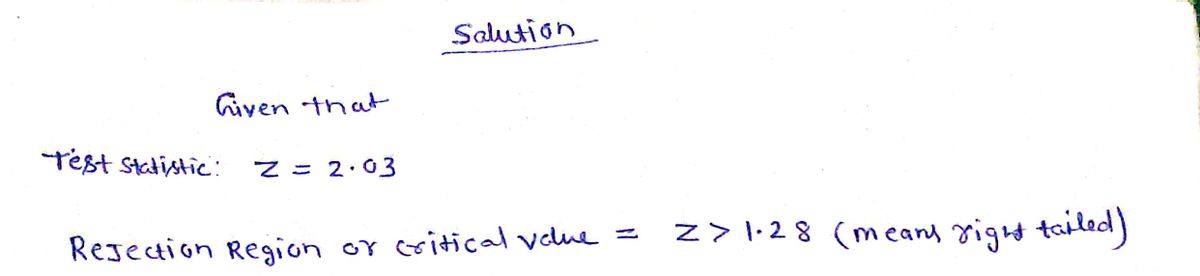
Test statistic z = 2.03; Rejection Region : z> 1.28
i) Choose the correct hypotheses
Find the significance level a of the test; ii) Graph and calculate/estimate the P-value; iv) State your conclusion for the test.
O A. Ho: H = Ho vs HA: H * Ho
O B. Ho: H = Ho vs HA: H < Ho
OC. Ho: u > Ho vs HA: u = Po
O D. Ho: µ = Ho vs HA: H > Po
ii) Significance level a =(Keep two digits after decimal point)
iii) Which of the following shaded area represent the p-value of this test?
OA.
ов.
-3 -2 -1 0 1 2 3
-3 -2 -1 0 1 2 3
Oc.
OD.
-3 -2 -1 0 1 2 3
-3 -2 -1 0 1 2 3
Calculate P-value: P-value = (Keep four digits after decimal point)
iv) Choose All of the correct statements from the following:
O Do not reject H, since p-value <a
Do not reject Ho since p-value > a
O Do not reject Ho since z is not in the rejection region
O Reject Ho since p-value < a
O Reject H, since p-value > a
O Reject Ho since z is in the rejection region
O o o
Expert Solution
Step 1

Trending now
This is a popular solution!

Step by step
Solved in 2 steps with 2 images

Recommended textbooks for you
MATLAB: An Introduction with Applications
Statistics
ISBN:
9781119256830
Author:
Amos Gilat
Publisher:
John Wiley & Sons Inc

Probability and Statistics for Engineering and th…
Statistics
ISBN:
9781305251809
Author:
Jay L. Devore
Publisher:
Cengage Learning

Statistics for The Behavioral Sciences (MindTap C…
Statistics
ISBN:
9781305504912
Author:
Frederick J Gravetter, Larry B. Wallnau
Publisher:
Cengage Learning
MATLAB: An Introduction with Applications
Statistics
ISBN:
9781119256830
Author:
Amos Gilat
Publisher:
John Wiley & Sons Inc
Probability and Statistics for Engineering and th…
Statistics
ISBN:
9781305251809
Author:
Jay L. Devore
Publisher:
Cengage Learning
Statistics for The Behavioral Sciences (MindTap C…
Statistics
ISBN:
9781305504912
Author:
Frederick J Gravetter, Larry B. Wallnau
Publisher:
Cengage Learning

Elementary Statistics: Picturing the World (7th E…
Statistics
ISBN:
9780134683416
Author:
Ron Larson, Betsy Farber
Publisher:
PEARSON

The Basic Practice of Statistics
Statistics
ISBN:
9781319042578
Author:
David S. Moore, William I. Notz, Michael A. Fligner
Publisher:
W. H. Freeman

Introduction to the Practice of Statistics
Statistics
ISBN:
9781319013387
Author:
David S. Moore, George P. McCabe, Bruce A. Craig
Publisher:
W. H. Freeman