Body Fat. Where we considered the regression of percentage of body fat on nine body measurements: height, weight, hip, forearm, neck, wrist, triceps, scapula, and sup. Use the technology of your choice to do the following. a. Use the maximum- R2 criterion to obtain a regression equation for these data. b. Use the adjusted- R2 criterion to obtain a regression equation for these data. c. Use the Mallows’ Cp criterion to obtain a regression equation for these data. d. Are the regression equations obtained in parts (a), (b), and (c) the same? e. Use the analysis in parts (a), (b), and (c) to select a regression equation for these data. For the regression equation that you selected, obtain plots of residuals versus fitted values, residuals versus the included predictor variables, and a normal probability plot of the residuals. Perform a residual analysis to assess the appropriateness of the regression equation, constancy of the conditional standard deviations, and normality of the conditional distributions. Check for outliers and influential observations.


Correlation
Correlation defines a relationship between two independent variables. It tells the degree to which variables move in relation to each other. When two sets of data are related to each other, there is a correlation between them.
Linear Correlation
A correlation is used to determine the relationships between numerical and categorical variables. In other words, it is an indicator of how things are connected to one another. The correlation analysis is the study of how variables are related.
Regression Analysis
Regression analysis is a statistical method in which it estimates the relationship between a dependent variable and one or more independent variable. In simple terms dependent variable is called as outcome variable and independent variable is called as predictors. Regression analysis is one of the methods to find the trends in data. The independent variable used in Regression analysis is named Predictor variable. It offers data of an associated dependent variable regarding a particular outcome.
Body Fat. Where we considered the regression of percentage of body fat on nine body measurements: height, weight, hip, forearm, neck, wrist, triceps, scapula, and sup. Use the technology of your choice to do the following.
a. Use the maximum- R2 criterion to obtain a regression equation for these data.
b. Use the adjusted- R2 criterion to obtain a regression equation for these data.
c. Use the Mallows’ Cp criterion to obtain a regression equation for these data.
d. Are the regression equations obtained in parts (a), (b), and (c) the same?
e. Use the analysis in parts (a), (b), and (c) to select a regression equation for these data. For the regression equation that you selected, obtain plots of residuals versus fitted values, residuals versus the included predictor variables, and a normal probability plot of the residuals. Perform a residual analysis to assess the appropriateness of the regression equation, constancy of the conditional standard deviations, and normality of the conditional distributions. Check for outliers and influential observations.
Note:
Hey, since there are multiple subparts posted, we will answer first three subparts. If you want any specific subpart to be answered then please submit that subpart only or specify the subpart in your message.
a)
The data explores the relationship of body fat, fat, with predictor variables such as height, weight, hip, forearm, neck, wrist, triceps, scapula, and supula.
Best subsets regression:
Software procedure:
Step by step procedure to perform a regression analysis using Minitab software is given as follows:
- Choose Stat > Regression > Regression > Best Subsets.
- Under Response, enter the column of FAT.
- Under Free predictors, enter the columns of HEIGHT, WEIGHT, HIP, FOREARM, NECK, WRIST, TRICEPS, SCAPULA, SUPULA.
- Click Options, type 5 in Models of each size to print and click OK.
- Click OK.
Output using MINITAB software is given below:
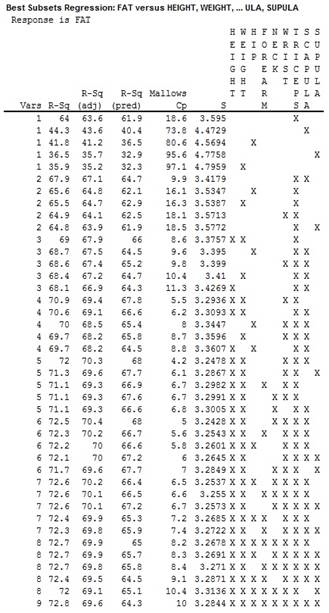
The output displays the top 5 subsets of each number of predictors in terms of the highest values of R2.
A careful observation of the output gives the maximum values of R2 for each number of predictors as follows:
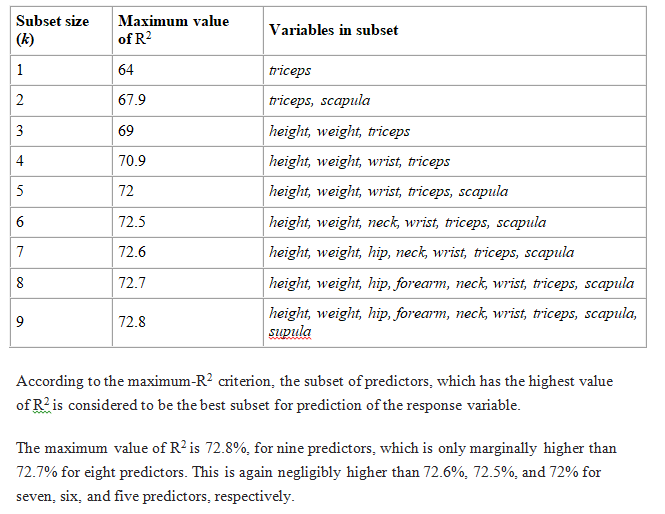
Increasing number of predictors in an analysis increases the complexity of analysis. An investigator usually does not wish to increase the complications of analysis for such a small increase in R2.
Thus, the other factors that are provided do not affect the analysis as it could be most preferable to use the regression equation corresponding to the five predictors such as height, weight, wrist, triceps, and scapula.

Step by step
Solved in 5 steps with 4 images


