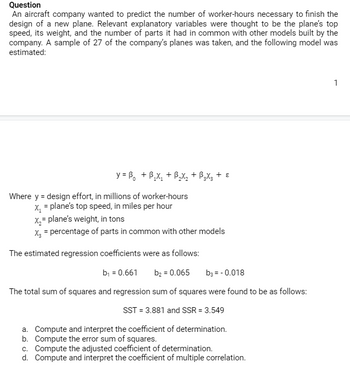
An aircraft company wanted to predict the number of worker-hours necessary to finish the design of a new plane. Relevant explanatory variables were thought to be the plane’s top speed, its weight, and the number of parts it had in common with other models built by the company. A sample of 27 of the company’s planes was taken, and the following model was estimated: y = 0 +11+22+33+ Where y = design effort, in millions of worker-hours 1 = plane’s top speed, in miles per hour 2= plane’s weight, in tons 3 = percentage of parts in common with other models The estimated regression coefficients were as follows: b1 = 0.661 b2 = 0.065 b3 = - 0.018 The total sum of squares and regression sum of squares were found to be as follows: SST = 3.881 and SSR = 3.549 Compute and interpret the coefficient of determination. Compute the error sum of squares. Compute the adjusted coefficient of determination. Compute and interpret the coefficient of multiple correlation.
An aircraft company wanted to predict the number of worker-hours necessary to finish the design of a new plane. Relevant explanatory variables were thought to be the plane’s top speed, its weight, and the number of parts it had in common with other models built by the company. A sample of 27 of the company’s planes was taken, and the following model was estimated:
y = 0 +11+22+33+
Where y = design effort, in millions of worker-hours
1 = plane’s top speed, in miles per hour
2= plane’s weight, in tons
3 = percentage of parts in common with other models
The estimated regression coefficients were as follows:
b1 = 0.661 b2 = 0.065 b3 = - 0.018
The total sum of squares and regression sum of squares were found to be as follows:
SST = 3.881 and SSR = 3.549
- Compute and interpret the coefficient of determination.
- Compute the error sum of squares.
- Compute the adjusted coefficient of determination.
- Compute and interpret the coefficient of
multiple correlation .
![](/static/compass_v2/shared-icons/check-mark.png)
Step by step
Solved in 2 steps
![Blurred answer](/static/compass_v2/solution-images/blurred-answer.jpg)
Here is the full ques.
![Question
An aircraft company wanted to predict the number of worker-hours necessary to finish the
design of a new plane. Relevant explanatory variables were thought to be the plane's top
speed, its weight, and the number of parts it had in common with other models built by the
company. A sample of 27 of the company's planes was taken, and the following model was
estimated:
y=B₁ + B₁₂x₁₂ + B₂X₂ + B3X3 + €
Where y = design effort, in millions of worker-hours
X₁ = plane's top speed, in miles per hour
x₂ = plane's weight, in tons
x₂ = percentage of parts in common with other models
The estimated regression coefficients were as follows:
b₁ = 0.661
b₂ = 0.065 b3 = -0.018
The total sum of squares and regression sum of squares were found to be as follows:
SST = 3.881 and SSR = 3.549
a. Compute and interpret the coefficient of determination.
b. Compute the error sum of squares.
c. Compute the adjusted coefficient of determination.
d. Compute and interpret the coefficient of multiple correlation.
1](https://content.bartleby.com/qna-images/question/b2d99d69-9bb7-4144-abd7-b3390f15cd0d/cf6bcf8e-2d02-4e40-ac9d-bfce5e7aff89/ogzbwli_thumbnail.png)
Compute and interpret the coefficient of
Number 4 answer is missing.
![MATLAB: An Introduction with Applications](https://www.bartleby.com/isbn_cover_images/9781119256830/9781119256830_smallCoverImage.gif)
![Probability and Statistics for Engineering and th…](https://www.bartleby.com/isbn_cover_images/9781305251809/9781305251809_smallCoverImage.gif)
![Statistics for The Behavioral Sciences (MindTap C…](https://www.bartleby.com/isbn_cover_images/9781305504912/9781305504912_smallCoverImage.gif)
![Elementary Statistics: Picturing the World (7th E…](https://www.bartleby.com/isbn_cover_images/9780134683416/9780134683416_smallCoverImage.gif)
![The Basic Practice of Statistics](https://www.bartleby.com/isbn_cover_images/9781319042578/9781319042578_smallCoverImage.gif)
![Introduction to the Practice of Statistics](https://www.bartleby.com/isbn_cover_images/9781319013387/9781319013387_smallCoverImage.gif)