A random sample is drawn from a population with mean μ = 56 and standard deviation σ = 4.7. [You may find it useful to reference the z table.]   a. Is the sampling distribution of the sample mean with n = 14 and n = 34 normally distributed? (Round the standard error to 3 decimal places.)     b. Can you conclude that the sampling distribution of the sample mean is normally distributed for both sample sizes? multiple choice 1 Yes, both the sample means will have a normal distribution. No, both the sample means will not have a normal distribution. No, only the sample mean with n = 14 will have a normal distribution. No, only the sample mean with n = 34 will have a normal distribution.   c. If the sampling distribution of the sample mean is normally distributed with n = 14, then calculate the probability that the sample mean falls between 56 and 58. (If appropriate, round final answer to 4 decimal places.)     Probability We cannot assume that the sampling distribution of the sample mean is normally distributed. We can assume that the sampling distribution of the sample mean is normally distributed and the probability that the sample mean falls between 56 and 58 is

MATLAB: An Introduction with Applications
6th Edition
ISBN:9781119256830
Author:Amos Gilat
Publisher:Amos Gilat
Chapter1: Starting With Matlab
Section: Chapter Questions
Problem 1P
icon
Related questions
Question

Can you explain question C 


A random sample is drawn from a population with mean μ = 56 and standard deviation σ = 4.7. [You may find it useful to reference the z table.]


a. Is the sampling distribution of the sample mean with n = 14 and n = 34 normally distributed(Round the standard error to 3 decimal places.)


b. Can you conclude that the sampling distribution of the sample mean is normally distributed for both sample sizes?

multiple choice 1

  • Yes, both the sample means will have a normal distribution.
  • No, both the sample means will not have a normal distribution.
  • No, only the sample mean with n = 14 will have a normal distribution.
  • No, only the sample mean with n = 34 will have a normal distribution.


c. If the sampling distribution of the sample mean is normally distributed with n = 14, then calculate the probability that the sample mean falls between 56 and 58. (If appropriate, round final answer to 4 decimal places.)


Probability
  • We cannot assume that the sampling distribution of the sample mean is normally distributed.
  • We can assume that the sampling distribution of the sample mean is normally distributed and the probability that the sample mean falls between 56 and 58 is
 
**Example Problem Analysis: Sampling Distribution of the Sample Mean**

**Problem Statement:**
A random sample is drawn from a population with a mean (\( \mu \)) of 56 and a standard deviation (\( \sigma \)) of 4.7. 

**Question A:**
Is the sampling distribution of the sample mean with \( n = 14 \) and \( n = 34 \) normally distributed? (Round the standard error to 3 decimal places.)

**Solution:**  

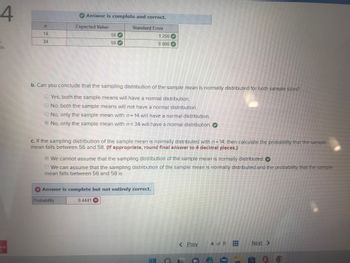
| \( n \) | Expected Value | Standard Error |
|--------|----------------|----------------|
| 14     | 56 ✔️           | 1.256 ✔️         |
| 34     | 56 ✔️           | 0.806 ✔️         |

The table confirms that the expected values are 56 for both sample sizes, and the standard errors are calculated as 1.256 for \( n = 14 \) and 0.806 for \( n = 34 \).

**Question B:**
Can you conclude that the sampling distribution of the sample mean is normally distributed for both sample sizes?

-
Transcribed Image Text:**Example Problem Analysis: Sampling Distribution of the Sample Mean** **Problem Statement:** A random sample is drawn from a population with a mean (\( \mu \)) of 56 and a standard deviation (\( \sigma \)) of 4.7. **Question A:** Is the sampling distribution of the sample mean with \( n = 14 \) and \( n = 34 \) normally distributed? (Round the standard error to 3 decimal places.) **Solution:** | \( n \) | Expected Value | Standard Error | |--------|----------------|----------------| | 14 | 56 ✔️ | 1.256 ✔️ | | 34 | 56 ✔️ | 0.806 ✔️ | The table confirms that the expected values are 56 for both sample sizes, and the standard errors are calculated as 1.256 for \( n = 14 \) and 0.806 for \( n = 34 \). **Question B:** Can you conclude that the sampling distribution of the sample mean is normally distributed for both sample sizes? -
Expert Solution
trending now

Trending now

This is a popular solution!

steps

Step by step

Solved in 4 steps with 1 images

Blurred answer
Follow-up Questions
Read through expert solutions to related follow-up questions below.
Follow-up Question

a and c are incorrect

### Educational Website Content: Sampling Distribution

---

#### Problem Description

Consider the following scenario involving sampling distributions and probability:

Given the sample sizes \( n \), expected value, and standard error as shown below:

| \( n \) | Expected Value | Standard Error |
|---------|----------------|----------------|
| 14      | 56             | 1.256          |
| 34      | 56             | 0.806          |

**Question: Can you conclude that the sampling distribution of the sample mean is normally distributed for both sample sizes?**

Options provided:

- Yes, both the sample means will have a normal distribution.
- No, both the sample means will not have a normal distribution.
- No, only the sample mean with \( n = 14 \) will have a normal distribution.
- No, only the sample mean with \( n = 34 \) will have a normal distribution. ✅

**Explanation:** According to the Central Limit Theorem, for large enough sample sizes (usually \( n > 30 \)), the sampling distribution of the sample mean will be approximately normally distributed regardless of the shape of the population distribution. Since \( n = 34 \) is above 30, we can conclude the sample mean for \( n = 34 \) is normally distributed. However, \( n = 14 \) is below 30 and may not be normally distributed unless the population is known to be normally distributed.

---

**Question: If the sampling distribution of the sample mean is normally distributed with \( n = 14 \), then calculate the probability that the sample mean falls between 56 and 58. (If appropriate, round final answer to 4 decimal places.)**

Options provided:

- We cannot assume that the sampling distribution of the sample mean is normally distributed. ✅
- We can assume that the sampling distribution of the sample mean is normally distributed and the probability that the sample mean falls between 56 and 58 is \( \text{Probability} = 0.4441 \).

**Feedback:** The answer provided is as follows and is indicated as partially correct:

**Answer:** Probability \(= 0.4441\) ❌

**Outcome:** The answer is complete but not entirely correct, implying there is an error in the calculation or the assumption.

#### Explanation of Graphs or Diagrams

There are no explicit graphs or diagrams in the given content. The table format presents sample sizes, expected values, and standard
Transcribed Image Text:### Educational Website Content: Sampling Distribution --- #### Problem Description Consider the following scenario involving sampling distributions and probability: Given the sample sizes \( n \), expected value, and standard error as shown below: | \( n \) | Expected Value | Standard Error | |---------|----------------|----------------| | 14 | 56 | 1.256 | | 34 | 56 | 0.806 | **Question: Can you conclude that the sampling distribution of the sample mean is normally distributed for both sample sizes?** Options provided: - Yes, both the sample means will have a normal distribution. - No, both the sample means will not have a normal distribution. - No, only the sample mean with \( n = 14 \) will have a normal distribution. - No, only the sample mean with \( n = 34 \) will have a normal distribution. ✅ **Explanation:** According to the Central Limit Theorem, for large enough sample sizes (usually \( n > 30 \)), the sampling distribution of the sample mean will be approximately normally distributed regardless of the shape of the population distribution. Since \( n = 34 \) is above 30, we can conclude the sample mean for \( n = 34 \) is normally distributed. However, \( n = 14 \) is below 30 and may not be normally distributed unless the population is known to be normally distributed. --- **Question: If the sampling distribution of the sample mean is normally distributed with \( n = 14 \), then calculate the probability that the sample mean falls between 56 and 58. (If appropriate, round final answer to 4 decimal places.)** Options provided: - We cannot assume that the sampling distribution of the sample mean is normally distributed. ✅ - We can assume that the sampling distribution of the sample mean is normally distributed and the probability that the sample mean falls between 56 and 58 is \( \text{Probability} = 0.4441 \). **Feedback:** The answer provided is as follows and is indicated as partially correct: **Answer:** Probability \(= 0.4441\) ❌ **Outcome:** The answer is complete but not entirely correct, implying there is an error in the calculation or the assumption. #### Explanation of Graphs or Diagrams There are no explicit graphs or diagrams in the given content. The table format presents sample sizes, expected values, and standard
Solution
Bartleby Expert
SEE SOLUTION
Similar questions
Recommended textbooks for you
MATLAB: An Introduction with Applications
Statistics
ISBN:
9781119256830
Author:
Amos Gilat
Publisher:
John Wiley & Sons Inc
Probability and Statistics for Engineering and th…
Statistics
ISBN:
9781305251809
Author:
Jay L. Devore
Publisher:
Cengage Learning
Statistics for The Behavioral Sciences (MindTap C…
Statistics
ISBN:
9781305504912
Author:
Frederick J Gravetter, Larry B. Wallnau
Publisher:
Cengage Learning
Elementary Statistics: Picturing the World (7th E…
Statistics
ISBN:
9780134683416
Author:
Ron Larson, Betsy Farber
Publisher:
PEARSON
The Basic Practice of Statistics
Statistics
ISBN:
9781319042578
Author:
David S. Moore, William I. Notz, Michael A. Fligner
Publisher:
W. H. Freeman
Introduction to the Practice of Statistics
Statistics
ISBN:
9781319013387
Author:
David S. Moore, George P. McCabe, Bruce A. Craig
Publisher:
W. H. Freeman