-4 -2 -4 -2 -4 -2 -4 -2


Inverse Normal Distribution
The method used for finding the corresponding z-critical value in a normal distribution using the known probability is said to be an inverse normal distribution. The inverse normal distribution is a continuous probability distribution with a family of two parameters.
Mean, Median, Mode
It is a descriptive summary of a data set. It can be defined by using some of the measures. The central tendencies do not provide information regarding individual data from the dataset. However, they give a summary of the data set. The central tendency or measure of central tendency is a central or typical value for a probability distribution.
Z-Scores
A z-score is a unit of measurement used in statistics to describe the position of a raw score in terms of its distance from the mean, measured with reference to standard deviation from the mean. Z-scores are useful in statistics because they allow comparison between two scores that belong to different normal distributions.
Pyramid Lake is on the Paiute Indian Reservation in Nevada. The lake is famous for cutthroat trout. Suppose a friend tells you that the average length of trout caught in Pyramid Lake is μ = 19 inches. However, a survey reported that of a random sample of 46 fish caught, the mean length was x = 18.6 inches, with estimated standard deviation s = 3.4 inches. Do these data indicate that the average length of a trout caught in Pyramid Lake is less than μ = 19 inches? Use α = 0.05.
What is the value of the sample test statistic? (Round your answer to three decimal places.)
Estimate the P-value.

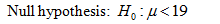
State the hypotheses.
That is, there is no evidence to conclude that average length of a trout caught in Pyramid Lake is less than 19 inches.

That is, there is evidence to conclude that average length of a trout caught in Pyramid Lake is less than 19 inches.
Decision rule:

Obtain the value of the test statistic.
The value of the test statistic is obtained below:
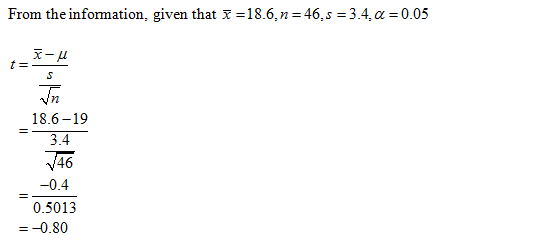
Thus, the value of the test statistic is –0.80.
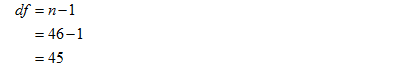
Obtain the degree of freedom:
Obtain the P-value.
The P-value is obtained below:
Use EXCEL Procedure for finding the P-value.
Follow the instruction to obtain the P-value:
- Open EXCEL
- Go to Formula bar.
- In formula bar enter the function as“=TDIST”
- Enter the test statistic value as ABS(–0.80).
- Enter the degrees of freedom as 45.
- Click enter.
EXCEL output:
From the EXCEL output, the P-value is 0.2140.
That is, the P-value lies between 0.100 and 0.250.
Correct option: Option b.
Use EXCEL MEGASTAT to sketch the sampling distribution and show the area corresponding to the P-value.
EXCEL MEGASTAT procedure:
Step 1: In EXCEL, Select Add-Ins>MegaStat>Probability.
Step 2: Choose Continuous probability distributions.
Step 3: Select t-distribution and select calculate probability given t and enter t as –0.80.
Step 4: Enter df as 45.
Step 5: Click Ok.
EXCEL MEGASTAT output:
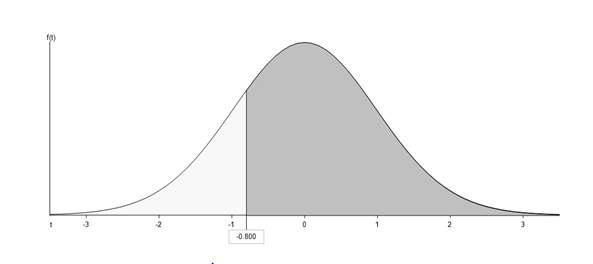
Correct option: option 1

Step by step
Solved in 5 steps with 8 images


