Concept explainers
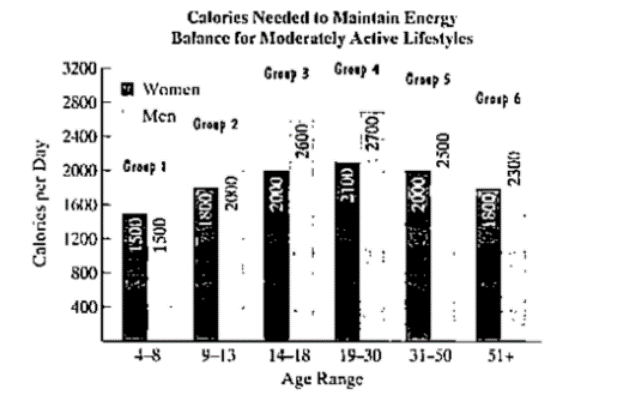
The bar graph shows the estimated number of calories per day needed to maintain energy balance for various gender and age groups for moderately active lifestyles. (Moderately active means a lifestyle that includes physical activity equivalent to walking 1.5 to 3 miles per day at 3 to 4 miles per hour, in addition to the light physical activity associated with typical day-to-day life.)

Source: U.S.D.A.
a. The mathematical model
describes the number of calories needed per day, W, by women in age group x with moderately active lifestyles. According to the model, how many calories per day are needed by women between the ages of 19 and 30. Inclusive, with this lifestyles? Done this underestimate or overestimate the number shown by the graph? By how much?
b. The mathematical model
describes the number of calories needed per day, M, by men in age group x with moderately active lifestyles. According to the model, how many calories per day are needed by men between the ages of 19 and 30, inclusive, with this lifestyle? Does this underestimate or overestimate the number shown by the graph? By how much?
c. Write a simplified rational expression that describes the ratio of the number of calories needed per day by women in age group x to the number of calories needed per day by men in age group x for people with moderately active lifestyles.
Want to see the full answer?
Check out a sample textbook solution
Chapter P Solutions
EP PRECALCULUS-MYLABMATH+ETEXT ACCESS
- Q6 MCQ . GDP does not directly include: the value of goods produced domestically and sold abroad. the value of intermediate goods sold during a period. the value of services rendered during a period. the value of final goods and services produced, but not sold, during a period.arrow_forwardThe table below shows the results from a study that compared speed (in miles per hour) and average fuel economy (in miler per gallon) for cars. Find a quadratic model for the data. Fuel Speed Economy (mph) (mpg) 15 22.3 20 25.5 25 27.5 30 29.0 35 28.8 40 30 45 29.9 50 30.2 55 30.4 60 27.4 28.8 65 70 25.3 y = 25.836x+0.049 y = 13.472x2+0.746x- 0.008 y = -.008x? +0.746x + 13.472 y = 0.049x + 25.836arrow_forwarda.) Provide the least squares regression equation, ŷ=a+bx. b.) Use your least squares regression equation to predict, in dollars, the resale value of a six year old vehicle of this model. c.) Provide the coefficient of determination value and in a sentence interpret the value.arrow_forward
- (c) Th Data Table Total Length (cm) 138.0 135.0 130.0 120.5 149.0 141.0 141.0 150.0 166.0 151.5 129.5 150.0 Print Weight (kg) 110 60 90 60 85 105 95 85 155 140 105 110 Done 0 X Critical Values for the Correlation Coefficient 3 0.997 4 0.950 5 0.878 6 0.811 7 0.754 8 0.707 9 0.666 10 0.632 11 0.602 12 0.576 13 0.553 14 0.532 15 0.514 16 0.497 17 0.482 18 0.468 19 0.456 20 0.444 21 0.433 22 0.423 23 0.413 24 0.404 25 0.396 26 0.388 27 0.381 0371 X not practical to v parts (a) througharrow_forwardThe data shown indicate the number of wins and the number of points scored for teams in a hockey league. Use a TI-83 Plus/TI-84 Plus calculator to construct the scatter plot. No. of wins, x 11 6 5 9 10 9 7 8 No. of points, y 15 26 29 20 16 18 24 23 Send data to Excel Part: 0 / 2 Part 1 of 2 Select the correct graph. Graph A Graph B y y 30+ 30 25 - 25 20- 20 15- 15 10- 10-arrow_forwardNumber 7 and 8arrow_forward
- The amount of carbon dioxide in the atmosphere, measured in parts per million, has been increasing as a result of the burning of oil and coal. The buildup of gases and particles traps heat and raises the planet’s temperature. The bar graph in Figure (a) gives the average atmospheric concentration of carbon dioxide and the average global temperature for six selected years. The data are displayed as a set of six points in a rectangular coordinate system in Figure (b) [see attached]. Solve, Use the data points (317, 57.04) and (354, 57.64), shown, but not labeled, in Figure (b) [see attached herewith] to obtain a linear function that models average global temperature, f(x), for an atmospheric carbon dioxide concentration of x parts per million. Round m to three decimal places and b to one decimal place. Then use the function to project average global temperature at a concentration of 600 parts per million.arrow_forwardNumber 6arrow_forwardWhat does a linear model look like? Explain what all of the pieces are?arrow_forward
- Find the Cartesian product of the following sets: Let A = {a, b, c, d}, B = {1, 2, 3}, and C = {5, 6} %3D 1. Find A x C. 2. Find B x C.arrow_forwardsolve asap the question with complete explanation within 15 mins or else downvotearrow_forwardA researcher proposing a research project defines the dependent variable as "achievement in mathematics." What difficulty does this definition present? How would you improve it?arrow_forward
 Big Ideas Math A Bridge To Success Algebra 1: Stu...AlgebraISBN:9781680331141Author:HOUGHTON MIFFLIN HARCOURTPublisher:Houghton Mifflin Harcourt
 Glencoe Algebra 1, Student Edition, 9780079039897...AlgebraISBN:9780079039897Author:CarterPublisher:McGraw HillAlgebra & Trigonometry with Analytic GeometryAlgebraISBN:9781133382119Author:SwokowskiPublisher:Cengage


