Concept explainers
In Exercises 141-153, use the five-step strategy for solving word problems.
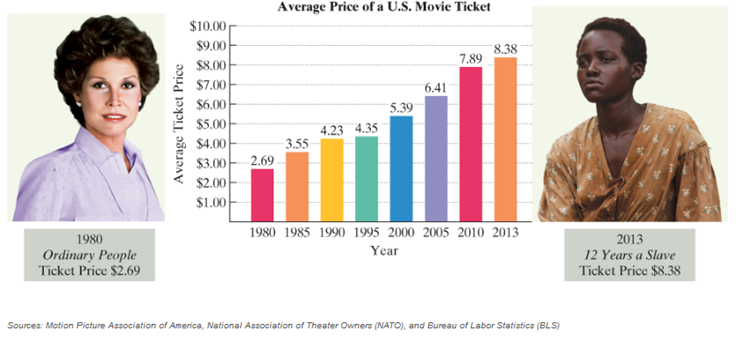
The bar graph shows the average price of a movie ticket for selected years from 1980 through 2013. The graph indicated that in 1980, the average movies ticket price was $2.69. For the period from 1980 through 2013, the price increased by approximately $0.17 per year. If this trend continues, by which year will the average price of a movie ticket be $9.49?

Want to see the full answer?
Check out a sample textbook solution
Chapter P Solutions
EP PRECALCULUS-MYLABMATH+ETEXT ACCESS
Additional Math Textbook Solutions
Calculus: Early Transcendentals (2nd Edition)
Mathematics for the Trades: A Guided Approach (11th Edition) (What's New in Trade Math)
Finite Mathematics for Business, Economics, Life Sciences and Social Sciences
Elementary Statistics: A Step By Step Approach
Precalculus: A Unit Circle Approach (3rd Edition)
Elementary & Intermediate Algebra
- In the triangle below, x = 7. Use the Law of Cosines to solve the triangle. A = B = C = 12 cm 18 cm B x cm ° о °arrow_forwardA triangular parcel of ground has sides of length 750 feet, 650 feet, and 535 feet. Find the measure of the largest angle. (Round your answer to one decimal place.)arrow_forwardA boat is sailing due east parallel to the shoreline at a speed of 10 miles per hour. At a given time, the bearing to a lighthouse is S 70° E, and 15 minutes later, the bearing is S 63° E (see figure). The lighthouse is located at the shoreline. Find the distance d from the boat to the shoreline. (Round your answer to one decimal place.) x mi N 63° WE 70° Sarrow_forward
- A 120-foot vertical tower is to be erected on the side of a hill that makes a 6° angle with the horizontal. Find the length of each of the two guy wires that will be anchored 75 feet uphill and downhill from the base of the tower (see figure). (Note that x = 120 in the figure. Round your answers to one decimal place.) shorter wire longer wire x ft ft ft XXXX -75 ft -75 ftarrow_forwardhelp with workarrow_forward۳/۱ +① العنوان I need a detailed drawing with explanatic Le R2X2 2) slots per pole per phase = 3/31 B: 18060 msl Kas Kdl Sin (1) I sin () sin(30) Sin (30) اذا ميريد شرح الكتب بس بالفراغ Cos (30) 0.866 4) Rotating 5) Synchronous speed, 120 x 50 SE 1000-950 1000 Copper losses 5kw 6 50.05 Rotor input 5 0.05 loo kw اذا ميريد شرح الكتب فقط ok 7) rotov DC 1000 rpm ined sove in peap PU + 96er Which of the following is converge, and which diverge? Give reasons for your answers with details. When your answer then determine the convergence sum if possible. 1/n -√ Which of the following is converge, and which diverge? Give reasons for your answers. with details. When your answer then determine the convergence sum if possible. 3" 6" '1Σn=1 (2-") n T GI Marrow_forward
- V ined sove in peaper Pu+96er Which of the following is converge, and which diverge? Give reasons for your answers with details. When your answer then determine the convergence sum if possible. 21/11 55 a Which of the following is converge, and which diverge? Give reasons for your answers with details. When your answer then determine the convergence sum if possible. 1Σn=1 (2-") n° 3" 6"arrow_forward: +0 1 R2X2 العنوان I need a detailed drawing with explanation L L 2) slots per pole per phase = 3/31 B = 180-60 msl Kd Kol, Sin (Info) Isin (6) sin(30) Sin (30) اذا ميريد شرح الكتب بس 0 بالفراغ 3) Cos (30) 0.866 4) Rotating 5) Synchronous speed, 120 x 50 6 50105 1000 S=1000-950 Loco mem 6. Copper losses: 5kw Rotor input loo kw 0.05 اذا ميريد شرح الكتب فقط look 7) rotov DC ined sove in peaper Pu+965 4 Which of the following is converge, and which diverge? Give reasons for your answers with details. When your answer then determine the convergence sum if possible. 111Σm=1 sin() Lake Which of the following is converge, and which diverge? Give reasons for your answers with details. When your answer then determine the convergence sum if possible. T TH Marrow_forwardい ined sove in beaper Anting. Pu+965 na lake an accident and lands at the bottom of the lake Q2// Find the volume of the region in first octant bounded by the coordinate planes and the plane passing through (1, 0, 0), (0, 2, 0), and (0, 0, 3). Q/Evaluate({ } } 3xze* dydzdx.arrow_forward
- | Evaluate (3xze** dydzdx. ined sove in peaper +9198 PU+965 Lake Find the volume of th solid bounded above by the Cy 2=6-1 o the sides by the cylinder x+y=9, and below by the xy-planearrow_forward... +① العنوان > पर ined sove in peaper ང་ PU+965 Q2// Draw and Evaluate, or Integrate, the function f(u, v) = (1+u2+v²)3 over the region enclosed by one loop of the lemniscate (u² + v²)² - (u² + v²) = 0. Lake 2 4-2² y 7357 r QI// Evaluate f²² cos(y) dxdydz. 4-y 이arrow_forwardし ined sove in peaper Anot in PV+96252 √4-x²-y² Q4// Convert √ √ √2x-x2 √√4-x-2_ 21xy² dzdydx to (a) cylindrical coordinates, (b) Spherical coordinates. ln3 (m3)2-x2 Q Draw and Evaluate Lake √x²+ dydarrow_forward
 Elementary AlgebraAlgebraISBN:9780998625713Author:Lynn Marecek, MaryAnne Anthony-SmithPublisher:OpenStax - Rice University
 Holt Mcdougal Larson Pre-algebra: Student Edition...AlgebraISBN:9780547587776Author:HOLT MCDOUGALPublisher:HOLT MCDOUGAL
 Algebra: Structure And Method, Book 1AlgebraISBN:9780395977224Author:Richard G. Brown, Mary P. Dolciani, Robert H. Sorgenfrey, William L. ColePublisher:McDougal Littell


