The bar graph shows the total amount Americans paid in federal taxes, in trillions of dollars, and the U.S population, in millions, from 2012 through 2015. Exercises 115-116 are based on the numbers displayed by the graph.
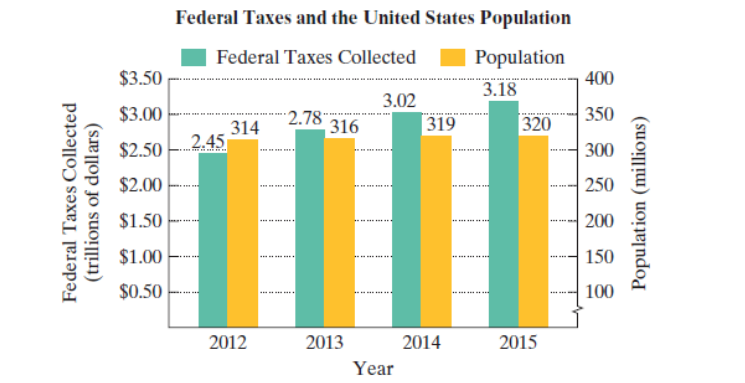
Sources: Internal Revenue Service and U.S. Census Bureau
a. In 2015, the United States government collectedS3.18 trillion in taxes. Express this number in scientific notation.
b. In 2015, the population of the United States was approximately 320 million. Express this number in scientific notation.
c. Use your scientific notation answers from parts (a)and (b) to answer this question: If the total 2015 tax collections were evenly divided among all Americans, how much would each citizen pay? Express the answer in decimal notation, rounded to the nearest dollar.
Want to see the full answer?
Check out a sample textbook solutionChapter P Solutions
EP PRECALCULUS-MYLABMATH+ETEXT ACCESS
- In Example 5, after how many days are 250 students infected?arrow_forwardIn 2012 in the United States, most electricity was generated from coal (37%), natural gas (30%), or nuclear power plants (19%). Hydropower accounted for 7% of the total electricity produced; other renewable sources such as wind or solar power accounted for 5%. Other nonrenewable sources (such as petroleum) made up the remaining 2%. Complete parts a through d below. a. Display the information in a bar graph. The bars, from left to right, represent coal, natural gas, nuclear power, hydropower, wind or solar, and other nonrenewable sources. Choose the correct graph below. O B. O A. Q 40- 40- 30- 30- Q 20- 20- 10- 10- G 0- Electricity Source Electricity Source Q 40 40- Q Q 30- 30- 20- 20- 10- 10- 0- 0- Electricity Source Electricity Source b. Which is easier to sketch relatively accurately, a pie chart or a bar chart? O A. A bar chart is easier because the bars are always in decreasing order of category percentages, which makes comparisons of categories easier. OB. A pie chart is easier…arrow_forwardWhat would be the number of subscribers on the year 2022?arrow_forward
- The director of a nonprofit ballet company in a medium-sized city in a certain country is planning its next fundraising campaign. In recent years, the program has found the percentages of donors and gift levels given in the accompanying table. Develop a spreadsheet model to calculate the total amount donated based on this information if the company contacts 900 potential donors to donate at the $100 level or below E Click the icon to view the percentages of donors and gift levels. C..... 3 Philanthropist $5,000 11 =B3*C3 4 Producer's Circle $1,000 25 =B4*C4 5 Director's Circle $500 49 =B5 C5 6 Principal $100 8% =B6*C6*$B$9 7 Soloist $50 14% =B7*C7*SB$9 8. 9 Solicitations 900 10 Total Donations =SUM(D2:D7) Enter the values in the model. (Type integers or decimals. Do not round.) B D Average Number of Gifts 1 Gift Level Amount Donations 2 Benefactor $10,000 3 Philanthropist $5,000 11 4 Producer's Circle $1,000 25 5 Director's Circle $500 49 6 Principal $100 8% ns? 7 Soloist $50 14% 8. 9…arrow_forwardThe table below shows a recent graduate's credit card balance each month after graduation. Month 1 2 3 Debt ($) 620.00 761.88 899.80 a) Look at the graph on your calculator. Based on this graph, what type of equation should represent this situation? Explain your answer. b) Use your calculator to find the equation that you feel best fits this data. What is the equation? c) Based on this equation, what is the predicted amount of debt for month 9 after graduation?arrow_forwardThe table shows the 2013 per capita total expenditure on health in 35 countries with the highest gross domestic product in 2013. Health expenditure per capita is the sum of public and private health expenditure (in PPP, international $) divided by population. Health expenditures include the provision of health services, family‑planning activities, nutrition activities, and emergency aid designated for health but exclude the provision of water and sanitation. Per Capita Total Expenditure on Health (International Dollars) Country Dollars Country Dollars Country Dollars Argentina 17251725 Indonesia 293293 Saudi Arabia 16811681 Australia 41914191 Iran 14141414 South Africa 11211121 Austria 48854885 Italy 31263126 Spain 28462846 Belgium 45264526 Japan 37413741 Sweden 42444244 Brazil 14541454 Korea, South 23982398 Switzerland 61876187 Canada 47594759 Malaysia 938938 Thailand 658658 China 646646 Mexico 10611061 Turkey 10531053 Colombia 843843 Netherlands 56015601 United…arrow_forward
- The creator of a new online multiplayer survival game has been tracking the monthly downloads of the game. The following table shows the monthly downloads (in thousands) for each month of the current and previous year. Click on the datafile logo to reference the data. The datafile logo. Month Downloads Month Downloads (previous year) (thousands) (current year) (thousands) February 33.0 January 31.0 March 34.0 February 32.0 April 34.0 March 33.0 May 31.0 April 34.0 June 32.0 May 33.0 July 33.0 June 32.0 August 35.0 July 35.0 September 36.0 August 33.0 October 37.0 September 33.0 November 34.0 October 31.0 December 35.0 a. Compute the mean, median, and mode for number of downloads in the previous year. Mean (to 3 decimals) thousand Median (to 2 decimal) thousand Mode (to 2 decimal) thousand b. Compute the mean, median, and mode for number of downloads in the current year. Mean (to 3 decimals) thousand Median (to 2…arrow_forwardCharity Navigator is America's leading independent charity evaluator. The data in the Excel Online file below show the total expenses ($), the percentage of the total budget spent on administrative expenses, the percentage spent on fundraising, and the percentage spent on program expenses for 10 supersized charities. Administrative expenses include overhead, administrative staff and associated costs, and organizational meetings. Fundraising expenses are what a charity spends to raise money, and program expenses are what the charity spends on the programs and services it exists to deliver. The sum of the three percentages does not add to 100% because of rounding. Construct a spreadsheet to answer the following questions. Charity # Charity Total Expenses ($) Administrative Expenses (%) Fundraising Expenses (%) Program Expenses (%) 1 American Red Cross 3355147520 3.8 3.9 92.1 2 World Vision 1200410940 3.8 7.6 88.4 3 Smithsonian Institution 1078888839 23.3 2.6 73.7 4 Food For…arrow_forwardCharity Navigator is America's leading independent charity evaluator. The data in the Excel Online file below show the total expenses ($), the percentage of the total budget spent on administrative expenses, the percentage spent on fundraising, and the percentage spent on program expenses for 10 supersized charities. Administrative expenses include overhead, administrative staff and associated costs, and organizational meetings. Fundraising expenses are what a charity spends to raise money, and program expenses are what the charity spends on the programs and services it exists to deliver. The sum of the three percentages does not add to 100% because of rounding. Construct a spreadsheet to answer the following questions.arrow_forward
- Charity Navigator is America's leading independent charity evaluator. The data in the Excel Online file below show the total expenses ($), the percentage of the total budget spent on administrative expenses, the percentage spent on fundraising, and the percentage spent on program expenses for 10 supersized charities. Administrative expenses include overhead, administrative staff and associated costs, and organizational meetings. Fundraising expenses are what a charity spends to raise money, and program expenses are what the charity spends on the programs and services it exists to deliver. The sum of the three percentages does not add to 100% because of rounding. Construct a spreadsheet to answer the following questions.arrow_forwardDefine mathematical models.arrow_forwardThe owner of a radio station wants to determine how much airtime songs take up. The owner collects the song length in seconds of 10 popular songs. The data are reproduced in the table below. Calculate the mode(s) using a TI-83. TI-83 plus, or TI-84 graphing calculator. Length of Songs in Seconds 279 219 298 134 206 293 165 227 230 212arrow_forward
- College Algebra (MindTap Course List)AlgebraISBN:9781305652231Author:R. David Gustafson, Jeff HughesPublisher:Cengage LearningAlgebra: Structure And Method, Book 1AlgebraISBN:9780395977224Author:Richard G. Brown, Mary P. Dolciani, Robert H. Sorgenfrey, William L. ColePublisher:McDougal Littell
- Trigonometry (MindTap Course List)TrigonometryISBN:9781337278461Author:Ron LarsonPublisher:Cengage Learning