
Concept explainers
Videos
Introduction:
Company NEFI is involved in the manufacturing wood stoves for more than 75 years. The company manufactures four models of stoves namely W1, W2, W3 and W4 of which W3 had outsold other products due to its performance.
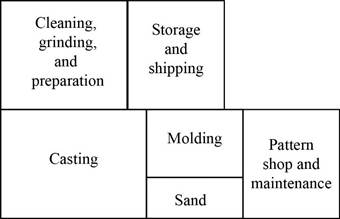
The company uses wooden pattern for manufacturing stoves. The wooden pattern is covered with sand molding in which the molten iron is poured to form the shape of a stove. Later, the molten iron is cooled and taken to next stages like cleaning, grinding and preparation. Finally, the product is tested to identify any defects.
The company has its maintenance and pattern shop in the same room, which increases the time for people from other department to fetch products. Person P and Person B can serve 10 people per hour. Average of 4 people from casting and 3 from molding arrive at the counter each hour.
It takes average of 3 minutes for the people from casting department and 1 minute for people from molding department to reach the pattern shop and maintenance room. The layout is shown in the diagram.
The company has restructured the layout, which is shown below. After restructuring, it takes 1 minute to reach pattern shop and maintenance from casting, while the time from molding department remains same.
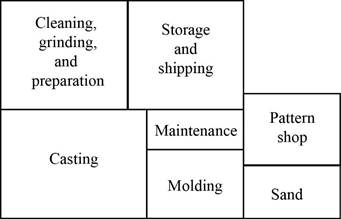
With new improved layout, Person B can serve 6 people per hour from the casting department and Person P can serve 7 people per hour from the molding shop.
To determine: The saving per hour with the new factory layout.
Want to see the full answer?
Check out a sample textbook solution
Chapter D Solutions
OPEARATIONS MANAG.REV CUSTOM 2017


- Examine the conflicts between improving customer service levels and controlling costs in sales. Strategies to Balance Both customer service levels and controlling costs in sales 1.Outsourcing and workforce optimization 2. AI-driven customer supportarrow_forwardhow can you gain trust in a negotiation setting?arrow_forward✓ Custom $€ .0 .on File Home Insert Share Page Layout Formulas Data Review View Help Draw Arial 10 B B14 ✓ X✓ fx 1400 > 甘く 曲 > 冠 > Comments Editing ✓ . . . P Q R S T 3 A Production cost ($/unit) B с D E F G H J K L M N $74.00 4 Inventory holding cost ($/unit) $1.50 5 Lost sales cost ($/unit) $82.00 6 Overtime cost ($/unit) $6.80 7 Undertime cost ($/unit) $3.20 8 Rate change cost ($/unit) $5.00 9 Normal production rate (units) 2,000 10 Ending inventory (previous Dec.) 800 11 Cumulative 12 13 Month Demand Cumulative Demand Product Production Availability Ending Inventory Lost Cumulative Cumulative Product Sales 14 January 1,400 1,475 15 FUERANZ222222223323333BRUINE 14 February 1,000 2,275 Month January February Demand Demand Production Availability Ending Inventory Lost Sales 1,400 #N/A 1,475 #N/A #N/A #N/A 1,000 #N/A 2,275 #N/A #N/A #N/A 16 March 1,800 2,275 March 1,800 #N/A 2,275 #N/A #N/A #N/A 17 April 2,700 2,275 April 2,700 #N/A 2,275 #N/A #N/A #N/A 18 May 3,000 2,275 May 3,000 #N/A…arrow_forward
 Practical Management ScienceOperations ManagementISBN:9781337406659Author:WINSTON, Wayne L.Publisher:Cengage,
 Foundations of Business (MindTap Course List)MarketingISBN:9781337386920Author:William M. Pride, Robert J. Hughes, Jack R. KapoorPublisher:Cengage Learning