
>LCPO< FUND OF STATISTICS
5th Edition
ISBN: 9781034509998
Author: Sullivan
Publisher: PEARSON
expand_more
expand_more
format_list_bulleted
Concept explainers
Videos
Textbook Question
Chapter B.6, Problem 29AYU
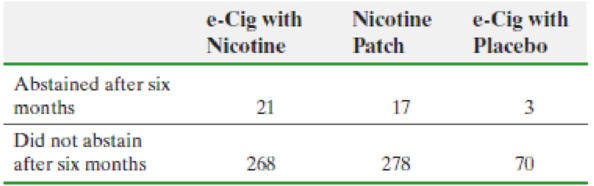
Another E-Cig Study In a study of adult smokers who wanted to quit, 657 subjects were randomly assigned to one of three treatment groups: subjects in Group 1 were given nicotine e-cigarettes, subjects in Group 2 were given nicotine patches, and subjects in Group 3 were given placebo e-cigarettes. The response variable was whether the subject maintained abstinence from cigarettes for six months, verified using exhaled breath carbon monoxide measurement.
- (a) What type of experimental design is this?
- (b) What is the response variable?
- (c) What are the treatments? How many levels does the treatment have?
- (d) Explain why it is not appropriate to use a one-way ANOVA to analyze the effectiveness of e-cigs with nicotine. Suggest an appropriate analysis.
- (e) The results of the study are shown to the right. Using the procedure suggested in part (d), perform the analysis regarding the effectiveness of the treatment. Be sure to state the null and alternative hypotheses.
Source: Bullen, Christopher, The Lancet Volume 382, Issue 9905, 16 Nov 2013 doi:10.1016/S0140-6736(13)61842-5
Expert Solution & Answer
Want to see the full answer?
Check out a sample textbook solution
Students have asked these similar questions
Illustrate 2/7×4/5 using a rectangular region. Explain your work. 
Write three other different proportions equivalent to the following using the same values as in the given proportion 3 foot over 1 yard equals X feet over 5 yards
2. An experiment is set up to test the effectiveness of a new drug for balancing
people's mood. The table below contains the results of the patients before and
after taking the drug. The possible scores are the integers from 0 to 10, where
0 indicates a depressed mood and 10 indicates and elated mood.
Patient Before
After
1
4
4
2
3
3
3
6
4
4
1
2
5
6
5
6
1
3
7
4
7
8
6
9
1
4
10
5
4
Assuming the differences of the observations to be symmetric, but not normally
distributed, investigate the effectiveness of the drug at the 5% significance level.
[4 Marks]
Chapter B.6 Solutions
>LCPO< FUND OF STATISTICS
Ch. B.6 - The acronym ANOVA stands for __________ __...Ch. B.6 - True or False: To perform a one-way ANOVA, the...Ch. B.6 - True or False: To perform a one-way ANOVA, the...Ch. B.6 - The variability among the sample means is called...Ch. B.6 - The variability within each treatment group, which...Ch. B.6 - True or False: The F-test statistic is F0=MSTMSE.Ch. B.6 - In Problems 7 and 8, fill in the ANOVA table. 7.Ch. B.6 - In Problems 7 and 8, fill in the ANOVA table. 8.Ch. B.6 - In Problems 9 and 10, determine the F-test...Ch. B.6 - In Problems 9 and 10, determine the F-test...
Ch. B.6 - NW 11. The following data represent a simple...Ch. B.6 - The following data represent a simple random...Ch. B.6 - NW 13. Corn Production The data in the table...Ch. B.6 - Soybean Yield The data in the table represent the...Ch. B.6 - Which Delivery Method Is Best? At a community...Ch. B.6 - Births by Day of Week An obstetrician knew that...Ch. B.6 - Rates of Return A stock analyst wondered whether...Ch. B.6 - Reaction Time In an online psychology experiment...Ch. B.6 - Car-Buying Discrimination To determine if there is...Ch. B.6 - Crash Data The Insurance Institute for Highway...Ch. B.6 - Lower Your Cholesterol Researcher Francisco...Ch. B.6 - pH in Rain An environmentalist wanted to determine...Ch. B.6 - Age and Politics Do peoples political philosophy...Ch. B.6 - Concrete Strength An engineer wants to know if the...Ch. B.6 - Analyzing Journal Article Results Researchers...Ch. B.6 - Prob. 27AYUCh. B.6 - Diversity and pH The following data represent the...Ch. B.6 - Another E-Cig Study In a study of adult smokers...Ch. B.6 - What are the requirements to perform a one-way...Ch. B.6 - What is the mean square due to treatment estimate...Ch. B.6 - Why does a large value of the F statistic provide...Ch. B.6 - In a one-way ANOVA, explain what it means to...
Knowledge Booster


Learn more about
Need a deep-dive on the concept behind this application? Look no further. Learn more about this topic, statistics and related others by exploring similar questions and additional content below.Similar questions
- 3. (i) Consider the following R code: wilcox.test(UK Supermarkets $Salary ~ UKSupermarkets $Supermarket) (a) Which test is being used in this code? (b) What is the name of the dataset under consideration? How would be adapt this code if we had ties? What other command can be used which deals with ties? (ii) Consider the following R code: install packages("nortest") library(nortest) lillie.test (Differences) (a) Assuming the appropriate dataset has been imported and attached, what is wrong with this code? (b) If this code were to be corrected, what would be determined by run- ning it? [3 Marks]arrow_forward1. (i) Explain the difference in application between the Mann-Whitney U test and the Wilcoxon Signed-Rank test, i.e. in which scenarios would each test be used? (ii) What is the main procedure underlying these nonparametric tests? [3 Marks]arrow_forwardYou may need to use the appropriate appendix table or technology to answer this question. You are given the following information obtained from a random sample of 4 observations. 24 48 31 57 You want to determine whether or not the mean of the population from which this sample was taken is significantly different from 49. (Assume the population is normally distributed.) (a) State the null and the alternative hypotheses. (Enter != for ≠ as needed.) H0: Ha: (b) Determine the test statistic. (Round your answer to three decimal places.) (c) Determine the p-value, and at the 5% level of significance, test to determine whether or not the mean of the population is significantly different from 49. Find the p-value. (Round your answer to four decimal places.) p-value = State your conclusion. Reject H0. There is insufficient evidence to conclude that the mean of the population is different from 49.Do not reject H0. There is sufficient evidence to conclude that the…arrow_forward
- 65% of all violent felons in the prison system are repeat offenders. If 43 violent felons are randomly selected, find the probability that a. Exactly 28 of them are repeat offenders. b. At most 28 of them are repeat offenders. c. At least 28 of them are repeat offenders. d. Between 22 and 26 (including 22 and 26) of them are repeat offenders.arrow_forward08:34 ◄ Classroom 07:59 Probs. 5-32/33 D ا. 89 5-34. Determine the horizontal and vertical components of reaction at the pin A and the normal force at the smooth peg B on the member. A 0,4 m 0.4 m Prob. 5-34 F=600 N fr th ar 0. 163586 5-37. The wooden plank resting between the buildings deflects slightly when it supports the 50-kg boy. This deflection causes a triangular distribution of load at its ends. having maximum intensities of w, and wg. Determine w and wg. each measured in N/m. when the boy is standing 3 m from one end as shown. Neglect the mass of the plank. 0.45 m 3 marrow_forwardExamine the Variables: Carefully review and note the names of all variables in the dataset. Examples of these variables include: Mileage (mpg) Number of Cylinders (cyl) Displacement (disp) Horsepower (hp) Research: Google to understand these variables. Statistical Analysis: Select mpg variable, and perform the following statistical tests. Once you are done with these tests using mpg variable, repeat the same with hp Mean Median First Quartile (Q1) Second Quartile (Q2) Third Quartile (Q3) Fourth Quartile (Q4) 10th Percentile 70th Percentile Skewness Kurtosis Document Your Results: In RStudio: Before running each statistical test, provide a heading in the format shown at the bottom. “# Mean of mileage – Your name’s command” In Microsoft Word: Once you've completed all tests, take a screenshot of your results in RStudio and paste it into a Microsoft Word document. Make sure that snapshots are very clear. You will need multiple snapshots. Also transfer these results to the…arrow_forward
- Examine the Variables: Carefully review and note the names of all variables in the dataset. Examples of these variables include: Mileage (mpg) Number of Cylinders (cyl) Displacement (disp) Horsepower (hp) Research: Google to understand these variables. Statistical Analysis: Select mpg variable, and perform the following statistical tests. Once you are done with these tests using mpg variable, repeat the same with hp Mean Median First Quartile (Q1) Second Quartile (Q2) Third Quartile (Q3) Fourth Quartile (Q4) 10th Percentile 70th Percentile Skewness Kurtosis Document Your Results: In RStudio: Before running each statistical test, provide a heading in the format shown at the bottom. “# Mean of mileage – Your name’s command” In Microsoft Word: Once you've completed all tests, take a screenshot of your results in RStudio and paste it into a Microsoft Word document. Make sure that snapshots are very clear. You will need multiple snapshots. Also transfer these results to the…arrow_forwardExamine the Variables: Carefully review and note the names of all variables in the dataset. Examples of these variables include: Mileage (mpg) Number of Cylinders (cyl) Displacement (disp) Horsepower (hp) Research: Google to understand these variables. Statistical Analysis: Select mpg variable, and perform the following statistical tests. Once you are done with these tests using mpg variable, repeat the same with hp Mean Median First Quartile (Q1) Second Quartile (Q2) Third Quartile (Q3) Fourth Quartile (Q4) 10th Percentile 70th Percentile Skewness Kurtosis Document Your Results: In RStudio: Before running each statistical test, provide a heading in the format shown at the bottom. “# Mean of mileage – Your name’s command” In Microsoft Word: Once you've completed all tests, take a screenshot of your results in RStudio and paste it into a Microsoft Word document. Make sure that snapshots are very clear. You will need multiple snapshots. Also transfer these results to the…arrow_forward2 (VaR and ES) Suppose X1 are independent. Prove that ~ Unif[-0.5, 0.5] and X2 VaRa (X1X2) < VaRa(X1) + VaRa (X2). ~ Unif[-0.5, 0.5]arrow_forward
- 8 (Correlation and Diversification) Assume we have two stocks, A and B, show that a particular combination of the two stocks produce a risk-free portfolio when the correlation between the return of A and B is -1.arrow_forward9 (Portfolio allocation) Suppose R₁ and R2 are returns of 2 assets and with expected return and variance respectively r₁ and 72 and variance-covariance σ2, 0%½ and σ12. Find −∞ ≤ w ≤ ∞ such that the portfolio wR₁ + (1 - w) R₂ has the smallest risk.arrow_forward7 (Multivariate random variable) Suppose X, €1, €2, €3 are IID N(0, 1) and Y2 Y₁ = 0.2 0.8X + €1, Y₂ = 0.3 +0.7X+ €2, Y3 = 0.2 + 0.9X + €3. = (In models like this, X is called the common factors of Y₁, Y₂, Y3.) Y = (Y1, Y2, Y3). (a) Find E(Y) and cov(Y). (b) What can you observe from cov(Y). Writearrow_forward
arrow_back_ios
SEE MORE QUESTIONS
arrow_forward_ios
Recommended textbooks for you
 Glencoe Algebra 1, Student Edition, 9780079039897...AlgebraISBN:9780079039897Author:CarterPublisher:McGraw Hill
 College Algebra (MindTap Course List)AlgebraISBN:9781305652231Author:R. David Gustafson, Jeff HughesPublisher:Cengage Learning
Glencoe Algebra 1, Student Edition, 9780079039897...
Algebra
ISBN:9780079039897
Author:Carter
Publisher:McGraw Hill
College Algebra (MindTap Course List)
Algebra
ISBN:9781305652231
Author:R. David Gustafson, Jeff Hughes
Publisher:Cengage Learning
Statistics 4.1 Point Estimators; Author: Dr. Jack L. Jackson II;https://www.youtube.com/watch?v=2MrI0J8XCEE;License: Standard YouTube License, CC-BY
Statistics 101: Point Estimators; Author: Brandon Foltz;https://www.youtube.com/watch?v=4v41z3HwLaM;License: Standard YouTube License, CC-BY
Central limit theorem; Author: 365 Data Science;https://www.youtube.com/watch?v=b5xQmk9veZ4;License: Standard YouTube License, CC-BY
Point Estimate Definition & Example; Author: Prof. Essa;https://www.youtube.com/watch?v=OTVwtvQmSn0;License: Standard Youtube License
Point Estimation; Author: Vamsidhar Ambatipudi;https://www.youtube.com/watch?v=flqhlM2bZWc;License: Standard Youtube License