
Concept explainers
Videos
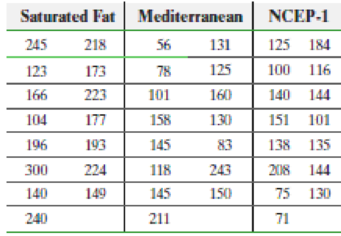
Lower Your Cholesterol Researcher Francisco Fuentes and his colleagues wanted to determine the most effective diet for reducing LDL cholesterol, the so-called “bad” cholesterol, among three diets: (1) a saturated-fat diet: 15% protein, 47% carbohydrates, and 38% fat (20% saturated fat, 12% monounsaturated fat, and 6% polyunsaturated fat); (2) the Mediterranean diet: 47% carbohydrates, and 38% fat (10% saturated fat, 22% monounsaturated fat, and 6% polyunsaturated fat); and (3) the US National Cholesterol Education Program or NCEP-1 Diet: 10% saturated fat, 12% monounsaturated fat, and 6% polyunsaturated fat. Participants in the study were shown to have the same levels of LDL cholesterol before the study and were randomly assigned to one of the three diets, or treatment groups. After 28 days, their LDL cholesterol levels were recorded. The data in the following table are based on this study.
- (a) Why is this study a completely randomized design?
- (b) What is the response variable? What is the explanatory variable that is controlled and set at three levels?
- (c) The participants were randomly assigned to one of three treatment groups. What is the purpose of randomization in this study?
- (d) State the null and alternative hypotheses.
- (e) Verify that the requirements to use the one-way ANOVA procedure are satisfied. Normal probability plots indicate that the sample data come from normal populations.
- (f) Are the
mean LDL cholesterol levels different at the α = 0.05 level of significance? - (g) Draw boxplots of the LDL cholesterol levels for the three groups to support the analytic results obtained in part (f).

Learn your wayIncludes step-by-step video

Chapter B.6 Solutions
>LCPO< FUND OF STATISTICS
Additional Math Textbook Solutions
Calculus: Early Transcendentals (2nd Edition)
A Problem Solving Approach To Mathematics For Elementary School Teachers (13th Edition)
Elementary Statistics (13th Edition)
Calculus for Business, Economics, Life Sciences, and Social Sciences (14th Edition)
Calculus: Early Transcendentals (2nd Edition)
A First Course in Probability (10th Edition)


- You may need to use the appropriate appendix table or technology to answer this question. You are given the following information obtained from a random sample of 4 observations. 24 48 31 57 You want to determine whether or not the mean of the population from which this sample was taken is significantly different from 49. (Assume the population is normally distributed.) (a) State the null and the alternative hypotheses. (Enter != for ≠ as needed.) H0: Ha: (b) Determine the test statistic. (Round your answer to three decimal places.) (c) Determine the p-value, and at the 5% level of significance, test to determine whether or not the mean of the population is significantly different from 49. Find the p-value. (Round your answer to four decimal places.) p-value = State your conclusion. Reject H0. There is insufficient evidence to conclude that the mean of the population is different from 49.Do not reject H0. There is sufficient evidence to conclude that the…arrow_forward65% of all violent felons in the prison system are repeat offenders. If 43 violent felons are randomly selected, find the probability that a. Exactly 28 of them are repeat offenders. b. At most 28 of them are repeat offenders. c. At least 28 of them are repeat offenders. d. Between 22 and 26 (including 22 and 26) of them are repeat offenders.arrow_forward08:34 ◄ Classroom 07:59 Probs. 5-32/33 D ا. 89 5-34. Determine the horizontal and vertical components of reaction at the pin A and the normal force at the smooth peg B on the member. A 0,4 m 0.4 m Prob. 5-34 F=600 N fr th ar 0. 163586 5-37. The wooden plank resting between the buildings deflects slightly when it supports the 50-kg boy. This deflection causes a triangular distribution of load at its ends. having maximum intensities of w, and wg. Determine w and wg. each measured in N/m. when the boy is standing 3 m from one end as shown. Neglect the mass of the plank. 0.45 m 3 marrow_forward
- Examine the Variables: Carefully review and note the names of all variables in the dataset. Examples of these variables include: Mileage (mpg) Number of Cylinders (cyl) Displacement (disp) Horsepower (hp) Research: Google to understand these variables. Statistical Analysis: Select mpg variable, and perform the following statistical tests. Once you are done with these tests using mpg variable, repeat the same with hp Mean Median First Quartile (Q1) Second Quartile (Q2) Third Quartile (Q3) Fourth Quartile (Q4) 10th Percentile 70th Percentile Skewness Kurtosis Document Your Results: In RStudio: Before running each statistical test, provide a heading in the format shown at the bottom. “# Mean of mileage – Your name’s command” In Microsoft Word: Once you've completed all tests, take a screenshot of your results in RStudio and paste it into a Microsoft Word document. Make sure that snapshots are very clear. You will need multiple snapshots. Also transfer these results to the…arrow_forwardExamine the Variables: Carefully review and note the names of all variables in the dataset. Examples of these variables include: Mileage (mpg) Number of Cylinders (cyl) Displacement (disp) Horsepower (hp) Research: Google to understand these variables. Statistical Analysis: Select mpg variable, and perform the following statistical tests. Once you are done with these tests using mpg variable, repeat the same with hp Mean Median First Quartile (Q1) Second Quartile (Q2) Third Quartile (Q3) Fourth Quartile (Q4) 10th Percentile 70th Percentile Skewness Kurtosis Document Your Results: In RStudio: Before running each statistical test, provide a heading in the format shown at the bottom. “# Mean of mileage – Your name’s command” In Microsoft Word: Once you've completed all tests, take a screenshot of your results in RStudio and paste it into a Microsoft Word document. Make sure that snapshots are very clear. You will need multiple snapshots. Also transfer these results to the…arrow_forwardExamine the Variables: Carefully review and note the names of all variables in the dataset. Examples of these variables include: Mileage (mpg) Number of Cylinders (cyl) Displacement (disp) Horsepower (hp) Research: Google to understand these variables. Statistical Analysis: Select mpg variable, and perform the following statistical tests. Once you are done with these tests using mpg variable, repeat the same with hp Mean Median First Quartile (Q1) Second Quartile (Q2) Third Quartile (Q3) Fourth Quartile (Q4) 10th Percentile 70th Percentile Skewness Kurtosis Document Your Results: In RStudio: Before running each statistical test, provide a heading in the format shown at the bottom. “# Mean of mileage – Your name’s command” In Microsoft Word: Once you've completed all tests, take a screenshot of your results in RStudio and paste it into a Microsoft Word document. Make sure that snapshots are very clear. You will need multiple snapshots. Also transfer these results to the…arrow_forward
- 2 (VaR and ES) Suppose X1 are independent. Prove that ~ Unif[-0.5, 0.5] and X2 VaRa (X1X2) < VaRa(X1) + VaRa (X2). ~ Unif[-0.5, 0.5]arrow_forward8 (Correlation and Diversification) Assume we have two stocks, A and B, show that a particular combination of the two stocks produce a risk-free portfolio when the correlation between the return of A and B is -1.arrow_forward9 (Portfolio allocation) Suppose R₁ and R2 are returns of 2 assets and with expected return and variance respectively r₁ and 72 and variance-covariance σ2, 0%½ and σ12. Find −∞ ≤ w ≤ ∞ such that the portfolio wR₁ + (1 - w) R₂ has the smallest risk.arrow_forward
- 7 (Multivariate random variable) Suppose X, €1, €2, €3 are IID N(0, 1) and Y2 Y₁ = 0.2 0.8X + €1, Y₂ = 0.3 +0.7X+ €2, Y3 = 0.2 + 0.9X + €3. = (In models like this, X is called the common factors of Y₁, Y₂, Y3.) Y = (Y1, Y2, Y3). (a) Find E(Y) and cov(Y). (b) What can you observe from cov(Y). Writearrow_forward1 (VaR and ES) Suppose X ~ f(x) with 1+x, if 0> x > −1 f(x) = 1−x if 1 x > 0 Find VaRo.05 (X) and ES0.05 (X).arrow_forwardJoy is making Christmas gifts. She has 6 1/12 feet of yarn and will need 4 1/4 to complete our project. How much yarn will she have left over compute this solution in two different ways arrow_forward
