
Videos
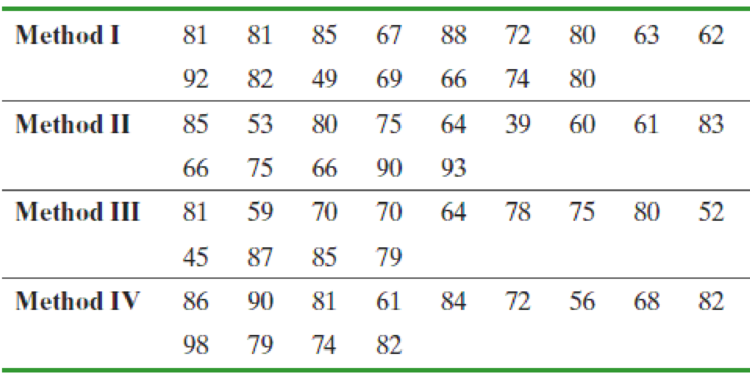
Which Delivery Method Is Best? At a community college, the mathematics department has been experimenting with four different delivery mechanisms for content in their Intermediate Algebra courses. One method is the traditional lecture (method I), the second is a hybrid format in which half the class time is online and the other half is face-to-face (method II), the third is online (method III), and the fourth is an emporium model from which students obtain their lectures and do their work in a lab with an instructor available for assistance (method IV). To assess the effectiveness of the four methods, students in each approach are given a final exam with the results shown next. Do the data suggest that any method has a different
- (a) What is the response variable in this study? Is it quantitative or qualitative?
- (b) What is the factor in this study? How many levels does it have?
- (c) Write the null and alternative hypotheses.
- (d) State the requirements that must be satisfied to use the one-way ANOVA procedure.
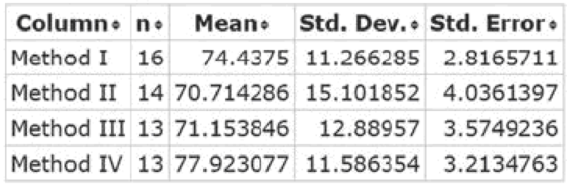
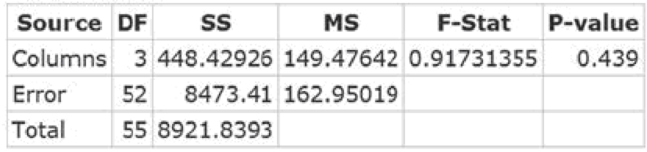
- (e) Assuming the requirements stated in part (d) are satisfied, use the following StatCrunch output to test the hypothesis of equal means at the α = 0.05 level of significance.
Analysis of Variance results:
Data stores in separate columns.
Column statistics
ANOVA table
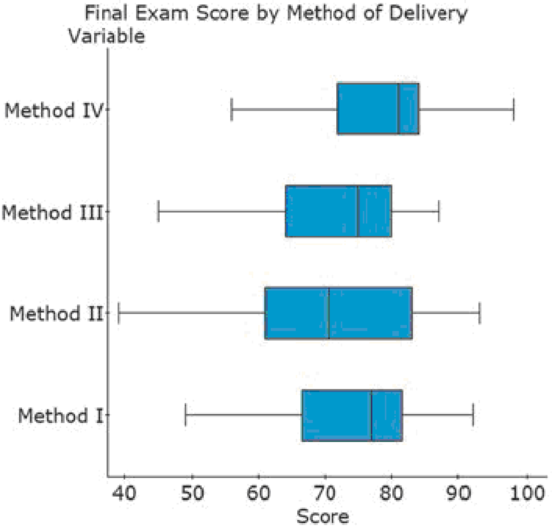
- (f) Shown in the next column are side-by-side boxplots drawn in StatCrunch of each delivery method. Do these support the results obtained in part (e)?
- (g) Interpret the P-value.
- (h) Verify the residuals are
normally distributed.

Learn your wayIncludes step-by-step video

Chapter B.6 Solutions
>LCPO< FUND OF STATISTICS
Additional Math Textbook Solutions
Pre-Algebra Student Edition
University Calculus: Early Transcendentals (4th Edition)
Elementary Statistics: Picturing the World (7th Edition)
Elementary Statistics (13th Edition)
Thinking Mathematically (6th Edition)


- Let x be a random variable that represents the percentage of successful free throws a professional basketball player makes in a season. Let y be a random variable that represents the percentage of successful field goals a professional basketball player makes in a season. A random sample of n = 6 professional basketball players gave the following information. x 75 72 75 81 74 81 y 46 39 42 47 49 50 Verify that Se ࣈ 3.591,a ࣈ –10.145, bࣈ0.729, and , and find the predicted percentage of successful field goals for a player with x= 88%successful free throws. Round your answer to the nearest tenth of a percentarrow_forwardAn editor wants to analyze if there is a significant difference in the ratings of books in four different genres. Random samples of book ratings were collected for four different genres. The editor recorded ratings in a 0 to 10 scale in the following table. Fiction Novel Biography Science&Technology 8.5 8.4 6.2 9.1 5.3 5.3 5.5 4.3 7.7 4.2 7.0 9.7 5.1 9.8 9.3 5.2 6.9 8.6 6.7 7.9 4.8 7.1 6.9 8.4 Shall we reject or not reject the claim that there are no differences among the population means of book ratings for the different genres? Use.arrow_forwardPeggy conducted a study to identify the randomness of rainy days in fall. For 15 days, she recorded whether it rained that day or not. They denoted a rainy day with the letter R, a day without rain with the letter N. R N N R R N N R R N N R R R R Test the sequence for randomness. Use .arrow_forward
- Consider the grades for the math and history exams for 10 students on a scale from 0 to 12 in the following table. Student Math History 1 4 8 2 5 9 3 7 9 4 12 10 5 10 8 6 8 5 7 9 6 8 9 6 9 11 9 10 7 10 Compute the Spearman correlation coefficient. Round your answer to three decimal places.arrow_forwardTo compare two elementary schools regarding teaching of reading skills, 12 sets of identical twins were used. In each case, one child was selected at random and sent to school A, and his or her twin was sent to school B. Near the end of fifth grade, an achievement test was given to each child. The results follow: Twin Pair 1 2 3 4 5 6 School A 169 157 115 99 119 113 School B 123 157 112 99 121 122 Twin Pair 7 8 9 10 11 12 School A 120 121 124 145 138 117 School B 153 90 124 140 142 102 Suppose a sign test for matched pairs with a 1% level of significance is used to test the hypothesis that the schools have the same effectiveness in teaching reading skills against the alternate hypothesis that the schools have different levels of effectiveness in teaching reading skills. Let p denote portion of positive signs when the scores of school B are subtracted from the corresponding scores of school…arrow_forwardA horse trainer teaches horses to jump by using two methods of instruction. Horses being taught by method A have a lead horse that accompanies each jump. Horses being taught by method B have no lead horse. The table shows the number of training sessions required before each horse performed the jumps properly. Method A 25 23 39 29 37 20 Method B 41 21 46 42 24 44 Method A 45 35 27 31 34 49 Method B 26 43 47 32 40 Use a rank-sum test with a5% level of significance to test the claim that there is no difference between the training sessions distributions. If the value of the sample test statistic R, the rank-sum, is 150, calculate the P-value. Round your answer to four decimal places.arrow_forward
- A data processing company has a training program for new salespeople. After completing the training program, each trainee is ranked by his or her instructor. After a year of sales, the same class of trainees is again ranked by a company supervisor according to net value of the contracts they have acquired for the company. The results for a random sample of 11 salespeople trained in the last year follow, where x is rank in training class and y is rank in sales after 1 year. Lower ranks mean higher standing in class and higher net sales. Person 1 2 3 4 5 6 x rank 8 11 2 4 5 3 y rank 7 10 1 3 2 4 Person 7 8 9 10 11 x rank 7 9 10 1 6 y rank 8 11 9 6 5 Using a 1% level of significance, test the claim that the relation between x and y is monotone (either increasing or decreasing). Verify that the Spearman rank correlation coefficient . This implies that the P-value lies between 0.002 and 0.01. State…arrow_forwardSand and clay studies were conducted at a site in California. Twelve consecutive depths, each about 15 cm deep, were studied and the following percentages of sand in the soil were recorded. 34.4 27.1 30.8 28.0 32.2 27.6 32.8 25.2 31.4 33.5 24.7 28.4 Converting this sequence of numbers to a sequence of symbols A and B, where A indicates a value above the median and B denotes a value below the median gives ABABABABAABB. Test the sequence for randomness about the median with a 5% level of significance. Verify that the number of runs is 10. What is the upper critical value c2? arrow_forwardSand and clay studies were conducted at a site in California. Twelve consecutive depths, each about 15 cm deep, were studied and the following percentages of sand in the soil were recorded. 34.4 27.1 30.8 28.0 32.2 27.6 32.8 25.2 31.4 33.5 24.7 28.4 Converting this sequence of numbers to a sequence of symbols A and B, where A indicates a value above the median and B denotes a value below the median gives ABABABABAABB. Test the sequence for randomness about the median with a 5% level of significance. Verify that the number of runs is 10. What is the upper critical value c2?arrow_forward
- 29% of all college students major in STEM (Science, Technology, Engineering, and Math). If 46 college students are randomly selected, find the probability thata. Exactly 11 of them major in STEM. b. At most 12 of them major in STEM. c. At least 11 of them major in STEM. d. Between 11 and 15 (including 11 and 15) of them major in STEM.arrow_forwardSand and clay studies were conducted at a site in California. Twelve consecutive depths, each about 15 cm deep, were studied and the following percentages of sand in the soil were recorded. 27.3 34.6 30.6 27.8 33.4 31.5 27.3 31.2 32.0 24.7 24.4 28.2 Test this sequence for randomness about the median. Converting this sequence of numbers to a sequence of symbols A and B, where A indicates a value above the median and B denotes a value below the median gives BAABAABAABBB. Verify that the number of runs is 7, the lower critical number is 3, and the upper critical number is 11. Use a 5% level of significance. State the conclusion of the test and interpret your results.arrow_forward29% of all college students major in STEM (Science, Technology, Engineering, and Math). If 46 college students are randomly selected, find the probability thata. Exactly 11 of them major in STEM. b. At most 12 of them major in STEM. c. At least 11 of them major in STEM. d. Between 11 and 15 (including 11 and 15) of them major in STEM.arrow_forward
 MATLAB: An Introduction with ApplicationsStatisticsISBN:9781119256830Author:Amos GilatPublisher:John Wiley & Sons Inc
 Probability and Statistics for Engineering and th...StatisticsISBN:9781305251809Author:Jay L. DevorePublisher:Cengage Learning
 Statistics for The Behavioral Sciences (MindTap C...StatisticsISBN:9781305504912Author:Frederick J Gravetter, Larry B. WallnauPublisher:Cengage Learning
 Elementary Statistics: Picturing the World (7th E...StatisticsISBN:9780134683416Author:Ron Larson, Betsy FarberPublisher:PEARSON
 The Basic Practice of StatisticsStatisticsISBN:9781319042578Author:David S. Moore, William I. Notz, Michael A. FlignerPublisher:W. H. Freeman
 Introduction to the Practice of StatisticsStatisticsISBN:9781319013387Author:David S. Moore, George P. McCabe, Bruce A. CraigPublisher:W. H. Freeman