Concept explainers
For Exercises 1-4, choose the correct letter.
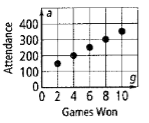
The attendances at the high school basketball games seemed to be effected by the success of the team. The graph at the right models the attendance over the first half of the season. Which function would also represent the data shown in the graph where

F.
H.
G.
I.
To find : Which function represents the data shown in the graph.
Answer to Problem 4STP
Option (G) is correct.
Explanation of Solution
Given information :
The attendance at the high school basketball seemed to be affected by the success of the tam. The graph in the question models the attendance over the first half of the season.
Calculation :
From the graph in the question, linear model is the most appropriate to model the data.
Now, in the option F is exponential function.
Option H and I are quadratic function.
Only G is the linear function.
Hence,
Option (G) is correct.
Chapter 9 Solutions
High School Math 2012 Common-core Algebra 1 Practice And Problem Solvingworkbook Grade 8/9
Additional Math Textbook Solutions
A Problem Solving Approach To Mathematics For Elementary School Teachers (13th Edition)
Introductory Statistics
Thinking Mathematically (6th Edition)
Calculus: Early Transcendentals (2nd Edition)
- What is the domain, range, increasing intervals (theres 3), decreasing intervals, roots, y-intercepts, end behavior (approaches four times), leading coffiencent status (is it negative, positivie?) the degress status (zero, undifined etc ), the absolute max, is there a absolute minimum, relative minimum, relative maximum, the root is that has a multiplicity of 2, the multiplicity of 3.arrow_forwardWhat is the vertex, axis of symmerty, all of the solutions, all of the end behaviors, the increasing interval, the decreasing interval, describe all of the transformations that have occurred EXAMPLE Vertical shrink/compression (wider). or Vertical translation down, the domain and range of this graph EXAMPLE Domain: x ≤ -1 Range: y ≥ -4.arrow_forward4. Select all of the solutions for x²+x - 12 = 0? A. -12 B. -4 C. -3 D. 3 E 4 F 12 4 of 10arrow_forward
- 2. Select all of the polynomials with the degree of 7. A. h(x) = (4x + 2)³(x − 7)(3x + 1)4 B h(x) = (x + 7)³(2x + 1)^(6x − 5)² ☐ Ch(x)=(3x² + 9)(x + 4)(8x + 2)ª h(x) = (x + 6)²(9x + 2) (x − 3) h(x)=(-x-7)² (x + 8)²(7x + 4)³ Scroll down to see more 2 of 10arrow_forward1. If all of the zeros for a polynomial are included in the graph, which polynomial could the graph represent? 100 -6 -2 0 2 100 200arrow_forward3. Select the polynomial that matches the description given: Zero at 4 with multiplicity 3 Zero at −1 with multiplicity 2 Zero at -10 with multiplicity 1 Zero at 5 with multiplicity 5 ○ A. P(x) = (x − 4)³(x + 1)²(x + 10)(x — 5)³ B - P(x) = (x + 4)³(x − 1)²(x − 10)(x + 5)³ ○ ° P(x) = (1 − 3)'(x + 2)(x + 1)"'" (x — 5)³ 51 P(r) = (x-4)³(x − 1)(x + 10)(x − 5 3 of 10arrow_forward
- Match the equation, graph, and description of transformation. Horizontal translation 1 unit right; vertical translation 1 unit up; vertical shrink of 1/2; reflection across the x axis Horizontal translation 1 unit left; vertical translation 1 unit down; vertical stretch of 2 Horizontal translation 2 units right; reflection across the x-axis Vertical translation 1 unit up; vertical stretch of 2; reflection across the x-axis Reflection across the x - axis; vertical translation 2 units down Horizontal translation 2 units left Horizontal translation 2 units right Vertical translation 1 unit down; vertical shrink of 1/2; reflection across the x-axis Vertical translation 2 units down Horizontal translation 1 unit left; vertical translation 2 units up; vertical stretch of 2; reflection across the x - axis f(x) = - =-½ ½ (x − 1)²+1 f(x) = x²-2 f(x) = -2(x+1)²+2 f(x)=2(x+1)²-1 f(x)=-(x-2)² f(x)=(x-2)² f(x) = f(x) = -2x²+1 f(x) = -x²-2 f(x) = (x+2)²arrow_forwardWhat is the vertex, increasing interval, decreasing interval, domain, range, root/solution/zero, and the end behavior?arrow_forwardThe augmented matrix of a linear system has been reduced by row operations to the form shown. Continue the appropriate row operations and describe the solution set of the original system. 1 -1 0 1 -2 00-4 0-6 0 0 1 - 3 3 0 001 4arrow_forward
- Solve the system. X1 - 3x3 = 10 4x1 + 2x2 + 3x3 = 22 ×2 + 4x3 = -2arrow_forwardUse the quadratic formula to find the zeros of the quadratic equation. Y=3x^2+48x+180arrow_forwardM = log The formula determines the magnitude of an earthquake, where / is the intensity of the earthquake and S is the intensity of a "standard earthquake." How many times stronger is an earthquake with a magnitude of 8 than an earthquake with a magnitude of 6? Show your work.arrow_forward
 Algebra and Trigonometry (6th Edition)AlgebraISBN:9780134463216Author:Robert F. BlitzerPublisher:PEARSON
 Contemporary Abstract AlgebraAlgebraISBN:9781305657960Author:Joseph GallianPublisher:Cengage Learning
 Linear Algebra: A Modern IntroductionAlgebraISBN:9781285463247Author:David PoolePublisher:Cengage Learning
 Algebra And Trigonometry (11th Edition)AlgebraISBN:9780135163078Author:Michael SullivanPublisher:PEARSON
 Introduction to Linear Algebra, Fifth EditionAlgebraISBN:9780980232776Author:Gilbert StrangPublisher:Wellesley-Cambridge Press
 College Algebra (Collegiate Math)AlgebraISBN:9780077836344Author:Julie Miller, Donna GerkenPublisher:McGraw-Hill Education


