Videos
The population of a city for years since 2000 is shown below. Which kind of function best models the data? Write an equation to model the data.
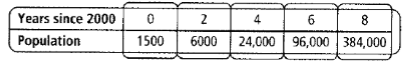
To find : Which type of function best model the given data, use differences or ratio.
Answer to Problem 26P
Exponential model is the most appropriate model and the equation to model the data is
Explanation of Solution
Given information :
The population of a city for years since 2000 is shown in table
Calculation :
To find the type of model from the given set of data use the followings:
- If the first difference of the y values is common, then linear model fits the data
- If the second difference of the y values is common, then quadratic model fit the data.
- If the y values have the common ratio, then an exponential model fits he data.
For the given set of data, find the find difference of the y values:
Since, the first differences is not common, so find the second differences
Since, the second differences are also not common, so find the ratio of the y values.
Since, y values have the common ratio. Therefore, exponential model is the most appropriate model.
Let the exponential model be
Substitute
Substitute
Therefore, the equation is
Hence,
Exponential model is the most appropriate model and the equation to model the data is
Chapter 9 Solutions
High School Math 2012 Common-core Algebra 1 Practice And Problem Solvingworkbook Grade 8/9
Additional Math Textbook Solutions
Calculus for Business, Economics, Life Sciences, and Social Sciences (14th Edition)
Pre-Algebra Student Edition
Elementary Statistics (13th Edition)
A Problem Solving Approach To Mathematics For Elementary School Teachers (13th Edition)
Calculus: Early Transcendentals (2nd Edition)
Basic Business Statistics, Student Value Edition


- For each graph below, state whether it represents a function. Graph 1 24y Graph 2 Graph 3 4 2 -8 -6 -4 -2 -2 2 4 6 Function? ○ Yes ○ No ○ Yes ○ No Graph 4 Graph 5 8 Function? Yes No Yes No -2. ○ Yes ○ No Graph 6 4 + 2 4 -8 -6 -4 -2 2 4 6 8 Yes -4++ Noarrow_forwardPractice k Help ises A 96 Anewer The probability that you get a sum of at least 10 is Determine the number of ways that the specified event can occur when two number cubes are rolled. 1. Getting a sum of 9 or 10 3. Getting a sum less than 5 2. Getting a sum of 6 or 7 4. Getting a sum that is odd Tell whether you would use the addition principle or the multiplication principle to determine the total number of possible outcomes for the situation described. 5. Rolling three number cubes 6. Getting a sum of 10 or 12 after rolling three number cubes A set of playing cards contains four groups of cards designated by color (black, red, yellow, and green) with cards numbered from 1 to 14 in each group. Determine the number of ways that the specified event can occur when a card is drawn from the set. 7. Drawing a 13 or 14 9. Drawing a number less than 4 8. Drawing a yellow or green card 10. Drawing a black, red, or green car The spinner is divided into equal parts. Find the specified…arrow_forwardAnswer the questionsarrow_forward
- Solve the problems on the imagearrow_forwardAsked this question and got a wrong answer previously: Third, show that v3 = (−√3, −3, 3)⊤ is an eigenvector of M3 . Also here find the correspondingeigenvalue λ3 . Just from looking at M3 and its components, can you say something about the remaining twoeigenvalues? If so, what would you say?arrow_forwardDetermine whether the inverse of f(x)=x^4+2 is a function. Then, find the inverse.arrow_forward
- The 173 acellus.com StudentFunctions inter ooks 24-25/08 R Mastery Connect ac ?ClassiD-952638111# Introduction - Surface Area of Composite Figures 3 cm 3 cm 8 cm 8 cm Find the surface area of the composite figure. 2 SA = [?] cm² 7 cm REMEMBER! Exclude areas where complex shapes touch. 7 cm 12 cm 10 cm might ©2003-2025 International Academy of Science. All Rights Reserved. Enterarrow_forwardYou are given a plane Π in R3 defined by two vectors, p1 and p2, and a subspace W in R3 spanned by twovectors, w1 and w2. Your task is to project the plane Π onto the subspace W.First, answer the question of what the projection matrix is that projects onto the subspace W and how toapply it to find the desired projection. Second, approach the task in a different way by using the Gram-Schmidtmethod to find an orthonormal basis for subspace W, before then using the resulting basis vectors for theprojection. Last, compare the results obtained from both methodsarrow_forwardPlane II is spanned by the vectors: - (2) · P² - (4) P1=2 P21 3 Subspace W is spanned by the vectors: 2 W1 - (9) · 1 W2 1 = (³)arrow_forward
 Algebra and Trigonometry (6th Edition)AlgebraISBN:9780134463216Author:Robert F. BlitzerPublisher:PEARSON
 Contemporary Abstract AlgebraAlgebraISBN:9781305657960Author:Joseph GallianPublisher:Cengage Learning
 Linear Algebra: A Modern IntroductionAlgebraISBN:9781285463247Author:David PoolePublisher:Cengage Learning
 Algebra And Trigonometry (11th Edition)AlgebraISBN:9780135163078Author:Michael SullivanPublisher:PEARSON
 Introduction to Linear Algebra, Fifth EditionAlgebraISBN:9780980232776Author:Gilbert StrangPublisher:Wellesley-Cambridge Press
 College Algebra (Collegiate Math)AlgebraISBN:9780077836344Author:Julie Miller, Donna GerkenPublisher:McGraw-Hill Education