
Videos
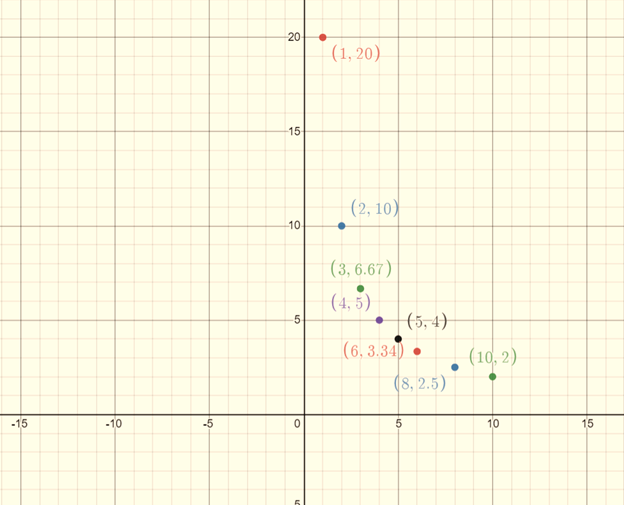
The graph of the given data and whether it is a linear or a non-linear function
Answer to Problem 28PPS
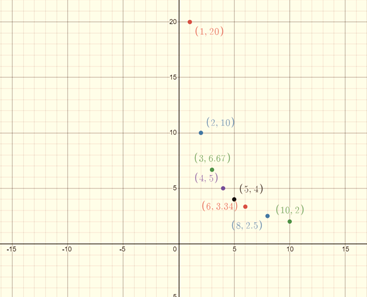
The given data represents a non-linear function
Explanation of Solution
Given:
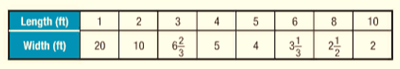
The table showing different lengths and their corresponding widths for a rectangle with fixed area of 20 square feet.
Calculation:
The graph for the given data can be depicted as:
Linear Functions: The graph of linear functions is always a straight line. These functions have the form
As the graph does not form a straight line, hence, the given data represents anon-linear function.
Chapter 9 Solutions
Pre-Algebra Student Edition
Additional Math Textbook Solutions
Introductory Statistics
Elementary Statistics: Picturing the World (7th Edition)
College Algebra with Modeling & Visualization (5th Edition)
Algebra and Trigonometry (6th Edition)
A First Course in Probability (10th Edition)
University Calculus: Early Transcendentals (4th Edition)


- A power outage occurs 6 min after the ride started. Passengers must wait for their cage to be manually cranked into the lowest position in order to exit the ride. Sine function model: h = −82.5 cos (3πt) + 97.5 where h is the height of the last passenger above the ground measured in feet and t is the time of operation of the ride in minutes. (a) What is the height of the last passenger at the moment of the power outage? Verify your answer by evaluating the sine function model. (b) Will the last passenger to board the ride need to wait in order to exit the ride? Explain.arrow_forwardThe Colossus Ferris wheel debuted at the 1984 New Orleans World's Fair. The ride is 180 ft tall, and passengers board the ride at an initial height of 15 ft above the ground. The height above ground, h, of a passenger on the ride is a periodic function of time, t. The graph displays the height above ground of the last passenger to board over the course of the 15 min ride. Height of Passenger in Ferris Wheel 180 160 140- €120 Height, h (ft) 100 80 60 40 20 0 ך 1 2 3 4 5 6 7 8 9 10 11 12 13 14 15 Time of operation, t (min) Sine function model: h = −82.5 cos (3πt) + 97.5 where h is the height of the passenger above the ground measured in feet and t is the time of operation of the ride in minutes. What is the period of the sine function model? Interpret the period you found in the context of the operation of the Ferris wheel. Answer:arrow_forward1. Graph the function f(x)=sin(x) −2¸ Answer: y -2π 一元 1 −1 -2 -3 -4+ 元 2πarrow_forward
- 3. Graph the function f(x) = −(x-2)²+4 Answer: f(x) 6 5 4 3 2+ 1 -6-5 -4-3-2-1 × 1 2 3 4 5 6 -1 -2+ ရာ -3+ -4+ -5 -6arrow_forward2. Graph the function f(x) = cos(2x)+1 Answer: -2π 一元 y 3 2- 1 -1 -2+ ရာ -3- Π 2πarrow_forward2. Graph the function f(x) = |x+1+2 Answer: -6-5-4-3-2-1 f(x) 6 5 4 3 2 1 1 2 3 4 5 6 -1 -2 -3 -4 -5 -6arrow_forward
- 1. The table shows values of a function f(x). What is the average rate of change of f(x) over the interval from x = 5 to x = 9? Show your work. X 4 f(x) LO 5 6 7 8 9 10 -2 8 10 11 14 18arrow_forward• Find a real-world situation that can be represented by a sinusoidal function. You may find something online that represents a sinusoidal graph or you can create a sinusoidal graph yourself with a measuring tape and a rope. • Provide a graph complete with labels and units for the x- and y-axes. • Describe the amplitude, period, and vertical shift in terms of the real-world situation.arrow_forwardf(x) = 4x²+6x 2. Given g(x) = 2x² +13x+15 and find 41 (4)(x) Show your work.arrow_forward
- f(x) = x² − 6x + 8 3. Given and g(x) = x -2 solve f(x) = g(x) using a table of values. Show your work.arrow_forward1. Graph the function f(x) = 3√x-2 Answer: -6-5 -4-3-2 -1 6 LO 5 f(x) 4 3 2+ 1 1 2 3 4 5 6 -1 -2+ -3 -4 -5 -6- 56arrow_forwardA minivan is purchased for $29,248. The value of the vehicle depreciates over time. • Describe the advantages and disadvantages of using a linear function to represent the depreciation of the car over time. • Describe the advantages and disadvantages of using an exponential function to represent the depreciation of the car over time. • The minivan depreciates $3,000 in the first year. Write either a linear or exponential function to represent the value of the car x years after it was sold.arrow_forward
 Algebra and Trigonometry (6th Edition)AlgebraISBN:9780134463216Author:Robert F. BlitzerPublisher:PEARSON
 Contemporary Abstract AlgebraAlgebraISBN:9781305657960Author:Joseph GallianPublisher:Cengage Learning
 Linear Algebra: A Modern IntroductionAlgebraISBN:9781285463247Author:David PoolePublisher:Cengage Learning
 Algebra And Trigonometry (11th Edition)AlgebraISBN:9780135163078Author:Michael SullivanPublisher:PEARSON
 Introduction to Linear Algebra, Fifth EditionAlgebraISBN:9780980232776Author:Gilbert StrangPublisher:Wellesley-Cambridge Press
 College Algebra (Collegiate Math)AlgebraISBN:9780077836344Author:Julie Miller, Donna GerkenPublisher:McGraw-Hill Education