
Videos
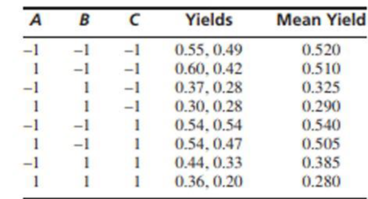
The article “Efficient Pyruvate Production by a Multi-Vitamin Auxotroph of Torulopsis glabrata: Key Role and Optimization of Vitamin Levels” (Y. Li. J. Chen, ct al. Applied Microbiology and Biotechnology, 200l:680–685) investigates the effects of the levels of several vitamins in a cell culture on the yield (in g/L) of pyruvate, a useful organic acid. The data in the following table are presented as two replicates of a 23 design. The factors are A: nicotinic acid. B: thiamine, and C: biotin. (Two statistically insignificant factors have been dropped. In the article, each factor was tested at four levels: we have collapsed these to two.)
- a. Compute estimates of the main effects and interactions, and the sum of squares and P-value for each.
- b. Is the additive model appropriate?
- c. What conclusions about the factors can be drawn from these results?
a.
Obtain the estimates of the main effects and interaction, and sum of squares and P- value for the each treatment combination.
Answer to Problem 4E
The estimates of the main effects and interaction, and sum of squares and P- value for the each treatment combination are given below:
ANOVA table:
| Variable | Effect | DF | Sum of squares | Mean Square | F | P |
| A | –0.04625 | 1 | 0.008556 | 0.008556 | 1.57 | 0.245 |
| B | –0.19875 | 1 | 0.158006 | 0.158006 | 29.03 | 0.001 |
| C | 0.01625 | 1 | 0.001056 | 0.001056 | 0.19 | 0.671 |
| AB | –0.02375 | 1 | 0.002256 | 0.002256 | 0.41 | 0.538 |
| AC | –0.02375 | 1 | 0.002256 | 0.002256 | 0.41 | 0.538 |
| BC | 0.00875 | 1 | 0.000306 | 0.000306 | 0.06 | 0.818 |
| ABC | –0.01125 | 1 | 0.000506 | 0.000506 | 0.09 | 0.768 |
| Error | 8 | 0.043550 | 0.005444 | |||
| Total | 15 |
Explanation of Solution
Given info:
The information is based on conducting the experiment on cell culture on the yield of pyruvate which has two levels for the factors of nicotinic acid (A), thiamine (B), and biotin (C). The experiment of chemical reaction has been conducted twice.
Calculation:
Denote the average yield of the factor A as
Factor A denotes the nicotinic, Factor B denotes the thiamine and Factor C denotes the biotin.
The effect estimate of the treatments is:
The effect estimate of treatment A is:
Substitute the corresponding values of mean yield,
The effect estimate of treatment B is:
The effect estimate of treatment C is:
The effect estimate of treatment AB is:
The effect estimate of treatment AC is:
The effect estimate of treatment BC is:
The effect estimate of treatment ABC is:
The estimates of the main effects and interaction, and sum of squares and P- value for the each treatment combination are given below:
Step-by-step procedure for finding the factorial design table is as follows:
Software procedure:
- Choose Stat > DOE > Factorial > Create Factorial Design.
- Under Type of Design, choose General full factorial design.
- From Number of factors, choose 3.
- Click Designs.
- In Factor A, type A under Name and type 2 Under Number of Levels.
- In Factor B, type B under Name and type 2 Under Number of Levels.
- . In Factor C, type C under Name and type 2 Under Number of Levels.
- From Number of replicates, choose 2.
- Click OK.
- Select Summary table under Results.
- Click OK.
- Enter the corresponding Yield in the newly created factorial design worksheet based on the levels of each factor.
Step-by-step procedure for finding the ANOVA table is as follows:
- Choose Stat > DOE > Factorial > Analyze Factorial Design.
- In Response, enter Yield.
- In Terms, select all the terms.
- In Results, choose “Model summary and ANOVA table”.
- Click OK in all the dialog boxes.
Output obtained by MINITAB procedure is as follows:
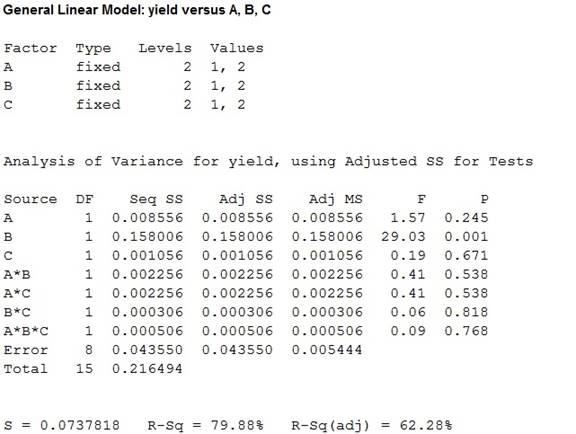
The sum of squares and P- values has been obtained for each treatment combination by using MINITAB.
Thus, the estimates of the main effects and interaction, and sum of squares and P- value for the each treatment combination are given below:
ANOVA table:
| Variable | Effect | DF | Sum of squares | Mean Square | F | P |
| A | –0.04625 | 1 | 0.008556 | 0.008556 | 1.57 | 0.245 |
| B | –0.19875 | 1 | 0.158006 | 0.158006 | 29.03 | 0.001 |
| C | 0.01625 | 1 | 0.001056 | 0.001056 | 0.19 | 0.671 |
| AB | –0.02375 | 1 | 0.002256 | 0.002256 | 0.41 | 0.538 |
| AC | –0.02375 | 1 | 0.002256 | 0.002256 | 0.41 | 0.538 |
| BC | 0.00875 | 1 | 0.000306 | 0.000306 | 0.06 | 0.818 |
| ABC | –0.01125 | 1 | 0.000506 | 0.000506 | 0.09 | 0.768 |
| Error | 8 | 0.043550 | 0.005444 | |||
| Total | 15 |
b.
Check whether the additive model is appropriate.
Answer to Problem 4E
Yes, the additive model is appropriate .
Explanation of Solution
Justification:
Principle rule to hold an additive model:
The additive model is acceptable when the interactions are small.
Hence the additive model is appropriate but interaction effect obtained in previous part (a) does not provide significant results.
c.
State whether any main effects and interaction are important.
Answer to Problem 4E
There is sufficient evidence to conclude that there is no significant difference between the means of two levels in main effect A at
There is sufficient evidence to conclude that there is significant difference between the means of two levels in main effect B at
There is sufficient evidence to conclude that there is no significant difference between the means of two levels in main effect C at
There is sufficient evidence to conclude that the interaction is not significant at
Explanation of Solution
Calculation:
The testing of hypotheses is as follows:
State the hypotheses:
Main factor A:
Null hypothesis:
Alternative hypothesis:
Main factor B:
Null hypothesis:
Alternative hypothesis:
Interaction AB:
Null hypothesis:
Alternative hypothesis:
Interaction AC:
Null hypothesis:
Alternative hypothesis:
Interaction BC:
Null hypothesis:
Alternative hypothesis:
Interaction ABC:
Null hypothesis:
Alternative hypothesis:
Assume that the level of significance as 0.05.
From the MINITAB output obtained in previous part (a), the P- value for main effects and interaction are given below:
| Treatment | P |
| A | 0.245 |
| B | 0.001 |
| C | 0.671 |
| AB | 0.538 |
| AC | 0.538 |
| BC | 0.818 |
| ABC | 0.768 |
Decision:
If
If
Conclusion:
Factor A:
Here, the P-value is greater than the level of significance.
That is,
By rejection rule, fail to reject the null hypothesis.
Thus, there is sufficient evidence to conclude that there is no significant difference between the means of two levels in main effect A at
Factor B:
Here, the P-value is less than the level of significance.
That is,
By rejection rule, reject the null hypothesis.
Thus, there is sufficient evidence to conclude that there is significant difference between the means of two levels in main effect B at
Factor C:
Here, the P-value is greater than the level of significance.
That is,
By rejection rule, fail to reject the null hypothesis.
Thus, there is sufficient evidence to conclude that there is no significant difference between the means of two levels in main effect C at
Interaction AB:
Here, the P-value is greater than the level of significance.
That is,
By rejection rule, fail to reject the null hypothesis.
Thus, there is sufficient evidence to conclude that the interaction AB is not significant at
Interaction AC:
Here, the P-value is greater than the level of significance.
That is,
By rejection rule, fail to reject the null hypothesis.
Thus, there is sufficient evidence to conclude that the interaction AC is not significant at
Interaction BC:
Here, the P-value is greater than the level of significance.
That is,
By rejection rule, fail to reject the null hypothesis.
Thus, there is sufficient evidence to conclude that the interaction BC is not significant at
Interaction ABC:
Here, the P-value is greater than the level of significance.
That is,
By rejection rule, fail to reject the null hypothesis.
Thus, there is sufficient evidence to conclude that the interaction ABC is not significant at
Hence the P-value of Factor B states that it has more effect on the yield than Factor A and Factor C.
Want to see more full solutions like this?
Chapter 9 Solutions
Statistics for Engineers and Scientists (Looseleaf)
Additional Math Textbook Solutions
APPLIED STAT.IN BUS.+ECONOMICS
Calculus: Early Transcendentals (2nd Edition)
Mathematics for the Trades: A Guided Approach (11th Edition) (What's New in Trade Math)
Elementary Statistics: Picturing the World (7th Edition)
A Problem Solving Approach To Mathematics For Elementary School Teachers (13th Edition)


- Let X be a continuous RV with PDF where a > 0 and 0 > 0 are parameters. verify that f-∞ /x (x)dx = 1. Find the CDF, Fx (7), of X.arrow_forward6. [20] Let X be a continuous RV with PDF 2(1), 1≤x≤2 fx(x) = 0, otherwisearrow_forwardA survey of 581 citizens found that 313 of them favor a new bill introduced by the city. We want to find a 95% confidence interval for the true proportion of the population who favor the bill. What is the lower limit of the interval? Enter the result as a decimal rounded to 3 decimal digits. Your Answer:arrow_forward
- A survey of 581 citizens found that 313 of them favor a new bill introduced by the city. We want to find a 95% confidence interval for the true proportion of the population who favor the bill. What is the lower limit of the interval? Enter the result as a decimal rounded to 3 decimal digits. Your Answer:arrow_forward2. The SMSA data consisting of 141 observations on 10 variables is fitted by the model below: 1 y = Bo+B1x4 + ẞ2x6 + ẞ3x8 + √1X4X8 + V2X6X8 + €. See Question 2, Tutorial 3 for the meaning of the variables in the above model. The following results are obtained: Estimate Std. Error t value Pr(>|t|) (Intercept) 1.302e+03 4.320e+02 3.015 0.00307 x4 x6 x8 x4:x8 x6:x8 -1.442e+02 2.056e+01 -7.013 1.02e-10 6.340e-01 6.099e+00 0.104 0.91737 -9.455e-02 5.802e-02 -1.630 0.10550 2.882e-02 2.589e-03 11.132 1.673e-03 7.215e-04 2.319 F) x4 1 3486722 3486722 17.9286 4.214e-05 x6 1 14595537 x8 x4:x8 x6:x8 1 132.4836 < 2.2e-16 1045693 194478 5.3769 0.02191 1 1198603043 1198603043 6163.1900 < 2.2e-16 1 25765100 25765100 1045693 Residuals 135 26254490 Estimated variance matrix (Intercept) x4 x6 x8 x4:x8 x6:x8 (Intercept) x4 x6 x8 x4:x8 x6:x8 0.18875694 1.866030e+05 -5.931735e+03 -2.322825e+03 -16.25142055 0.57188953 -5.931735e+03 4.228816e+02 3.160915e+01 0.61621781 -0.03608028 -0.00445013 -2.322825e+03…arrow_forwardIn some applications the distribution of a discrete RV, X resembles the Poisson distribution except that 0 is not a possible value of X. Consider such a RV with PMF where 1 > 0 is a parameter, and c is a constant. (a) Find the expression of c in terms of 1. (b) Find E(X). (Hint: You can use the fact that, if Y ~ Poisson(1), the E(Y) = 1.)arrow_forward
- Suppose that X ~Bin(n,p). Show that E[(1 - p)] = (1-p²)".arrow_forwardI need help with this problem and an explanation of the solution for the image described below. (Statistics: Engineering Probabilities)arrow_forwardI need help with this problem and an explanation of the solution for the image described below. (Statistics: Engineering Probabilities)arrow_forward
- This exercise is based on the following data on four bodybuilding supplements. (Figures shown correspond to a single serving.) Creatine(grams) L-Glutamine(grams) BCAAs(grams) Cost($) Xtend(SciVation) 0 2.5 7 1.00 Gainz(MP Hardcore) 2 3 6 1.10 Strongevity(Bill Phillips) 2.5 1 0 1.20 Muscle Physique(EAS) 2 2 0 1.00 Your personal trainer suggests that you supplement with at least 10 grams of creatine, 39 grams of L-glutamine, and 90 grams of BCAAs each week. You are thinking of combining Xtend and Gainz to provide you with the required nutrients. How many servings of each should you combine to obtain a week's supply that meets your trainer's specifications at the least cost? (If an answer does not exist, enter DNE.) servings of xtend servings of gainzarrow_forwardI need help with this problem and an explanation of the solution for the image described below. (Statistics: Engineering Probabilities)arrow_forwardI need help with this problem and an explanation of the solution for the image described below. (Statistics: Engineering Probabilities)arrow_forward
 MATLAB: An Introduction with ApplicationsStatisticsISBN:9781119256830Author:Amos GilatPublisher:John Wiley & Sons Inc
 Probability and Statistics for Engineering and th...StatisticsISBN:9781305251809Author:Jay L. DevorePublisher:Cengage Learning
 Statistics for The Behavioral Sciences (MindTap C...StatisticsISBN:9781305504912Author:Frederick J Gravetter, Larry B. WallnauPublisher:Cengage Learning
 Elementary Statistics: Picturing the World (7th E...StatisticsISBN:9780134683416Author:Ron Larson, Betsy FarberPublisher:PEARSON
 The Basic Practice of StatisticsStatisticsISBN:9781319042578Author:David S. Moore, William I. Notz, Michael A. FlignerPublisher:W. H. Freeman
 Introduction to the Practice of StatisticsStatisticsISBN:9781319013387Author:David S. Moore, George P. McCabe, Bruce A. CraigPublisher:W. H. Freeman