
Videos
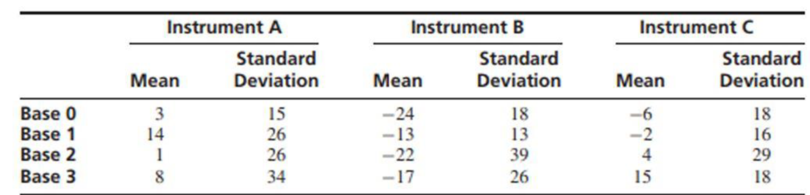
The article “Combined Analysis of Real-Time Kinematic GPS Equipment and Its Users for Height Determination” (W. Featherstone and M. Stewart, Journal of Surveying Engineering. 2001:31–51) presents a study of the accuracy of global positioning system (GPS) equipment in measuring heights. Three types of equipment were studied, and each was used to make measurements at four different base stations (in the article a fifth station was included, for which the results differed considerably from the other four). There were 60 measurements made with each piece of equipment at each base. The means and standard deviations of the measurement errors (in mm) are presented in the following table for each combination of equipment type and base station.
- a. Construct an ANOVA table. You may give
ranges for the P-values. - b. The question of interest is whether the mean error differs among instruments. It is not of interest to determine whether the error differs among base stations. For this reason, a surveyor suggests treating this as a randomized complete block design, with the base stations as the blocks. Is this appropriate? Explain.
a.
Construct the ANOVA.
Answer to Problem 9SE
The ANOVA table is,
| Source | DF | SS | MS | F | P |
| Base | 3 | 13,495 | 4498.3 | 7.5308 | 0.000 |
| Instrument | 2 | 90,990 | 45,495 | 76.164 | 0.000 |
| Interaction | 6 | 12,050 | 2,008.3 | 3.3622 | 0.003 |
| Error | 708 | 422,912 | 597.33 | ||
| Total | 719 | 539,447 |
Explanation of Solution
Calculation:
The given information is based on the accuracy of the global positioning system (GPS) which has 3 instruments that have to make measurements at four different base stations have 60 measurements with each piece of instrument at each base.
Let us denote the main effects of Instruments (I) with
The aim is to find the ANOVA.
State the hypothesis:
Main effect of Instruments:
Null hypothesis:
Alternative hypothesis:
Main effect of Base:
Null hypothesis:
Alternative hypothesis:
Interaction:
Null hypothesis:
Alternative hypothesis:
ANOVA table:
| Source | DF | SS | MS | F |
| Treatment | ||||
| Blocks | ||||
| Interaction | ||||
| Error | ||||
| Total |
Where,
Where, N is the sample size, I denotes the number of treatments,
Here, the number of treatments (I) is 3, the number of blocks (J) is 4 and the number of replicates (K) is 60.
Test the hypothesis on 5% level of significance:
Here, Instrument is the treatments and Base is the blocks.
Level of significance:
The level of significance is
Degrees of freedom:
Base degrees of freedom:
Instrument degrees of freedom:
Interaction degrees of freedom:
Error degrees of freedom:
Total degrees of freedom:
The treatment and block means are tabulated below:
| Base | Instruments | Block mean | ||
| Instrument A | Instrument B | Instrument C | ||
| 0 | 3 | –24 | –6 | –9 |
| 1 | 14 | –13 | –2 | –0.33 |
| 2 | 1 | –22 | 4 | –5.667 |
| 3 | 8 | –17 | 15 | 2 |
| Treatment mean | 6.5 | –19 | 2.75 | |
By observing the data, the values of
For Base:
The value of SSB (Base) is:
Substitute
The value of MSB (Base) is:
Substitute
For Instruments:
The value of SSTr ( Instruments) is:
Substitute
The value of MSTr (Instruments) is:
Substitute
For Interaction Factor (AB):
The value of SSAB is:
Substitute
The value of MSAB is:
Substitute
The value of MSE is:
Substitute
The value of SSE is:
The value of SST is:
The value of F statistic is:
For Base:
Substitute
Thus, the value of F statistic for Base is 7.5308.
For Instruments:
Substitute
Thus, the value of F statistic for Instruments is 76.164.
For Interaction factor (AB):
Substitute
Thus, the value of F statistic for interaction is 3.3622.
The ranges of P-values are:
For Base
Software procedure:
Step by step procedure to obtain the critical-value using the MINITAB software is given below:
- Choose Graph > Probability Distribution Plot choose View Probability> OK.
- From Distribution, choose ‘F’ distribution.
- Enter Numerator Df as 3.
- Enter Denominator Df as 708.
- Click the Shaded Area tab.
- Choose X Value and Right Tail for the region of the curve to shade.
- Enter the Data value as 7.5308.
- Click OK.
Output using the MINITAB software is given below:
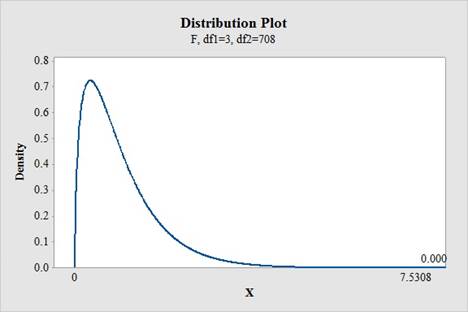
From the MINITAB output, the value of
For Instruments
Software procedure:
Step by step procedure to obtain the critical-value using the MINITAB software is given below:
- Choose Graph > Probability Distribution Plot choose View Probability> OK.
- From Distribution, choose ‘F’ distribution.
- Enter Numerator Df as 2.
- Enter Denominator Df as 708.
- Click the Shaded Area tab.
- Choose X Value and Right Tail for the region of the curve to shade.
- Enter the Data value as 76.164.
- Click OK.
Output using the MINITAB software is given below:
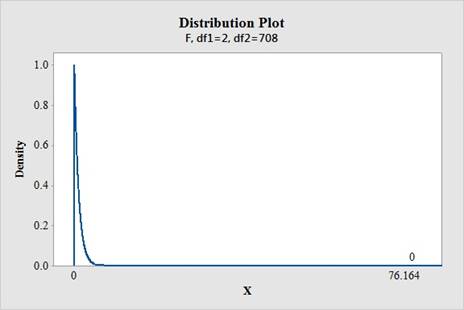
From the MINITAB output, the value of
For interaction
Software procedure:
Step by step procedure to obtain the critical-value using the MINITAB software is given below:
- Choose Graph > Probability Distribution Plot choose View Probability> OK.
- From Distribution, choose ‘F’ distribution.
- Enter Numerator Df as 6.
- Enter Denominator Df as 708.
- Click the Shaded Area tab.
- Choose X Value and Right Tail for the region of the curve to shade.
- Enter the Data value as 3.3622.
- Click OK.
Output using the MINITAB software is given below:
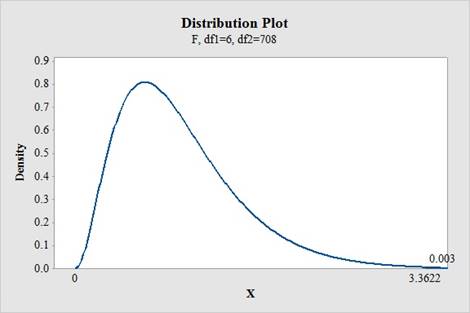
From the MINITAB output, the value of
The ANOVA table is,
| Source | DF | SS | MS | F | P |
| Base | 3 | 13,495 | 4498.3 | 7.5308 | 0.000 |
| Instrument | 2 | 90,990 | 45,495 | 76.164 | 0.000 |
| Interaction | 6 | 12,050 | 2,008.3 | 3.3622 | 0.003 |
| Error | 708 | 422,912 | 597.33 | ||
| Total | 719 | 539,447 |
Conclusion:
Base (Block):
Here, the P-value is less than the level of significance.
That is,
Therefore, the null hypothesis is rejected.
Thus, it can be concluded that there is a significant difference between block effects.
Instrument (Treatment):
Here, the P-value is less than the level of significance.
That is,
Therefore, the null hypothesis is rejected.
Thus, it can be concluded that there is a significant difference between treatment effects.
Interaction:
Here, the P-value is less than the level of significance.
That is,
Therefore, the null hypothesis is rejected.
Thus, it can be concluded that there is a significant effect of the interaction between the base (block) and instrument (treatment).
b.
Decide whether it is appropriate to treat the randomized complete block design with base stations as blocks to determine the interest that the mean error differs among the instruments.
Answer to Problem 9SE
No, it is not appropriate to treat the data with a randomized complete block design with base stations as blocks.
Explanation of Solution
In randomized complete block design, there must be no the interaction between the treatment factor and the blocking factor, so that the treatment factor may be interpreted in RBD. However, here, the interaction effect is significant, suggesting that it is not possible to use randomized complete block design.
Thus, the suggestion given by the surveyor to treat the randomized complete block design with base station as blocks is not appropriate.
Want to see more full solutions like this?
Chapter 9 Solutions
Statistics for Engineers and Scientists (Looseleaf)
Additional Math Textbook Solutions
Finite Mathematics for Business, Economics, Life Sciences and Social Sciences
A Problem Solving Approach To Mathematics For Elementary School Teachers (13th Edition)
Introductory Statistics
Elementary Statistics: Picturing the World (7th Edition)
APPLIED STAT.IN BUS.+ECONOMICS
Calculus: Early Transcendentals (2nd Edition)


- Suppose that you take a sample of 100 from a population that contains 45 percent Democrats. What sample size condition do you need to check here (if any)?What’s the standard error of ^P?Compare the standard errors of ^p n=100 for ,n=1000 , n=10,000, and comment.arrow_forwardSuppose that a class’s test scores have a mean of 80 and standard deviation of 5. You choose 25 students from the class. What’s the chance that the group’s average test score is more than 82?arrow_forwardSuppose that you collect data on 10 products and check their weights. The average should be 10 ounces, but your sample mean is 9 ounces with standard deviation 2 ounces. Find the standard score.What percentile is the standard score found in part a of this question closest to?Suppose that the mean really is 10 ounces. Do you find these results unusual? Use probabilities to explain.arrow_forward
- Suppose that you want to sample expensive computer chips, but you can have only n=3 of them. Should you continue the experiment?arrow_forwardSuppose that studies claim that 40 percent of cellphone owners use their phones in the car while driving. What’s the chance that more than 425 out of a random sample of 1,000 cellphone owners say they use their phones while driving?arrow_forwardSuppose that the average length of stay in Europe for American tourists is 17 days, with standard deviation 4.5. You choose a random sample of 16 American tourists. The sample of 16 stay an average of 18.5 days or more. What’s the chance of that happening?arrow_forward
- How do you recognize that a statistical problem requires you to use the CLT? Think of one or two clues you can look for. (Assume quantitative data.)arrow_forwardSuppose that you take a sample of 100 from a skewed population with mean 50 and standard deviation 15. What sample size condition do you need to check here (if any)?What’s the shape and center of the sampling distribution for ?What’s the standard error?arrow_forwardQuestion 3 The following stem-and-leaf displays the weekly salary of employees at this firm. Stem-and-Leaf Display Leaf Unit = 10.0 N=x 5 3 00123 12 4 0125888 (y) 5 11234456777 z 6 13568 5 7 154 2 8 46 i. Determine the value of x, y and z. [3] ii. What is the value of the median? [2] iii. Find the mode of this data set. iv. Calculate the range [1] [2]arrow_forward
- Let Y be a continuous RV with PDF otherwise Find the CDF, Fry), of Y . Find an expression for pth, p € (0, 1), quantile of the distribution. Find E(Y) and V(Y). Find E(-2Y + 1) and V(-3Y - 2). Find E(Y3).arrow_forwardLet X be a continuous RV with CDF Find P(X < 0), P(-1 < X < 1) and P(0.5 < X). Based on your answers to the above questions, what is the median of the distribu-tion? Why Find the PDF, fx (x), of X.arrow_forwardA survey of 581 citizens found that 313 of them favor a new bill introduced by the city. We want to find a 95% confidence interval for the true proportion of the population who favor the bill. What is the lower limit of the interval? Enter the result as a decimal rounded to 3 decimal digits. Your Answer:arrow_forward
 MATLAB: An Introduction with ApplicationsStatisticsISBN:9781119256830Author:Amos GilatPublisher:John Wiley & Sons Inc
 Probability and Statistics for Engineering and th...StatisticsISBN:9781305251809Author:Jay L. DevorePublisher:Cengage Learning
 Statistics for The Behavioral Sciences (MindTap C...StatisticsISBN:9781305504912Author:Frederick J Gravetter, Larry B. WallnauPublisher:Cengage Learning
 Elementary Statistics: Picturing the World (7th E...StatisticsISBN:9780134683416Author:Ron Larson, Betsy FarberPublisher:PEARSON
 The Basic Practice of StatisticsStatisticsISBN:9781319042578Author:David S. Moore, William I. Notz, Michael A. FlignerPublisher:W. H. Freeman
 Introduction to the Practice of StatisticsStatisticsISBN:9781319013387Author:David S. Moore, George P. McCabe, Bruce A. CraigPublisher:W. H. Freeman