
Videos
In Exercises 5–20, assume that the two samples are independent simple random samples selected from
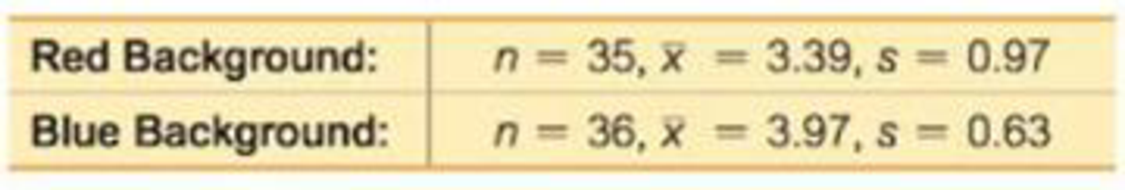
7. Color and Creativity Researchers from the University of British Columbia conducted trials to investigate the effects of color on creativity. Subjects with a red background were asked to think of creative uses for a brick; other subjects with a blue background were given the same task. Responses were scored by a panel of judges and results from scores of creativity are given below. Higher scores correspond to more creativity. The researchers make the claim that “blue enhances performance on a creative task.”
a. Use a 0.01 significance level to test the claim that blue enhances performance on a creative task.
b. Construct the confidence interval appropriate for the hypothesis test in part (a). What is it about the confidence interval that causes us to reach the same conclusion from part (a)?
Want to see the full answer?
Check out a sample textbook solution
Chapter 9 Solutions
Essentials of Statistics (6th Edition)
Additional Math Textbook Solutions
Pathways To Math Literacy (looseleaf)
College Algebra (Collegiate Math)
Thinking Mathematically (6th Edition)
Elementary Statistics ( 3rd International Edition ) Isbn:9781260092561
APPLIED STAT.IN BUS.+ECONOMICS


- A survey of 581 citizens found that 313 of them favor a new bill introduced by the city. We want to find a 95% confidence interval for the true proportion of the population who favor the bill. What is the lower limit of the interval? Enter the result as a decimal rounded to 3 decimal digits. Your Answer:arrow_forwardLet X be a continuous RV with PDF where a > 0 and 0 > 0 are parameters. verify that f-∞ /x (x)dx = 1. Find the CDF, Fx (7), of X.arrow_forward6. [20] Let X be a continuous RV with PDF 2(1), 1≤x≤2 fx(x) = 0, otherwisearrow_forward
- A survey of 581 citizens found that 313 of them favor a new bill introduced by the city. We want to find a 95% confidence interval for the true proportion of the population who favor the bill. What is the lower limit of the interval? Enter the result as a decimal rounded to 3 decimal digits. Your Answer:arrow_forwardA survey of 581 citizens found that 313 of them favor a new bill introduced by the city. We want to find a 95% confidence interval for the true proportion of the population who favor the bill. What is the lower limit of the interval? Enter the result as a decimal rounded to 3 decimal digits. Your Answer:arrow_forward2. The SMSA data consisting of 141 observations on 10 variables is fitted by the model below: 1 y = Bo+B1x4 + ẞ2x6 + ẞ3x8 + √1X4X8 + V2X6X8 + €. See Question 2, Tutorial 3 for the meaning of the variables in the above model. The following results are obtained: Estimate Std. Error t value Pr(>|t|) (Intercept) 1.302e+03 4.320e+02 3.015 0.00307 x4 x6 x8 x4:x8 x6:x8 -1.442e+02 2.056e+01 -7.013 1.02e-10 6.340e-01 6.099e+00 0.104 0.91737 -9.455e-02 5.802e-02 -1.630 0.10550 2.882e-02 2.589e-03 11.132 1.673e-03 7.215e-04 2.319 F) x4 1 3486722 3486722 17.9286 4.214e-05 x6 1 14595537 x8 x4:x8 x6:x8 1 132.4836 < 2.2e-16 1045693 194478 5.3769 0.02191 1 1198603043 1198603043 6163.1900 < 2.2e-16 1 25765100 25765100 1045693 Residuals 135 26254490 Estimated variance matrix (Intercept) x4 x6 x8 x4:x8 x6:x8 (Intercept) x4 x6 x8 x4:x8 x6:x8 0.18875694 1.866030e+05 -5.931735e+03 -2.322825e+03 -16.25142055 0.57188953 -5.931735e+03 4.228816e+02 3.160915e+01 0.61621781 -0.03608028 -0.00445013 -2.322825e+03…arrow_forward
- In some applications the distribution of a discrete RV, X resembles the Poisson distribution except that 0 is not a possible value of X. Consider such a RV with PMF where 1 > 0 is a parameter, and c is a constant. (a) Find the expression of c in terms of 1. (b) Find E(X). (Hint: You can use the fact that, if Y ~ Poisson(1), the E(Y) = 1.)arrow_forwardSuppose that X ~Bin(n,p). Show that E[(1 - p)] = (1-p²)".arrow_forwardI need help with this problem and an explanation of the solution for the image described below. (Statistics: Engineering Probabilities)arrow_forward
- I need help with this problem and an explanation of the solution for the image described below. (Statistics: Engineering Probabilities)arrow_forwardThis exercise is based on the following data on four bodybuilding supplements. (Figures shown correspond to a single serving.) Creatine(grams) L-Glutamine(grams) BCAAs(grams) Cost($) Xtend(SciVation) 0 2.5 7 1.00 Gainz(MP Hardcore) 2 3 6 1.10 Strongevity(Bill Phillips) 2.5 1 0 1.20 Muscle Physique(EAS) 2 2 0 1.00 Your personal trainer suggests that you supplement with at least 10 grams of creatine, 39 grams of L-glutamine, and 90 grams of BCAAs each week. You are thinking of combining Xtend and Gainz to provide you with the required nutrients. How many servings of each should you combine to obtain a week's supply that meets your trainer's specifications at the least cost? (If an answer does not exist, enter DNE.) servings of xtend servings of gainzarrow_forwardI need help with this problem and an explanation of the solution for the image described below. (Statistics: Engineering Probabilities)arrow_forward
 MATLAB: An Introduction with ApplicationsStatisticsISBN:9781119256830Author:Amos GilatPublisher:John Wiley & Sons Inc
 Probability and Statistics for Engineering and th...StatisticsISBN:9781305251809Author:Jay L. DevorePublisher:Cengage Learning
 Statistics for The Behavioral Sciences (MindTap C...StatisticsISBN:9781305504912Author:Frederick J Gravetter, Larry B. WallnauPublisher:Cengage Learning
 Elementary Statistics: Picturing the World (7th E...StatisticsISBN:9780134683416Author:Ron Larson, Betsy FarberPublisher:PEARSON
 The Basic Practice of StatisticsStatisticsISBN:9781319042578Author:David S. Moore, William I. Notz, Michael A. FlignerPublisher:W. H. Freeman
 Introduction to the Practice of StatisticsStatisticsISBN:9781319013387Author:David S. Moore, George P. McCabe, Bruce A. CraigPublisher:W. H. Freeman