
Videos
In Problems 15-30, transform each polar equation to an equation in rectangular coordinates. Then identify and graph the equation.
To find: Transform the polar equation to rectangular coordinates. Then identify and graph the equation.
Answer to Problem 23AYU
Solution:
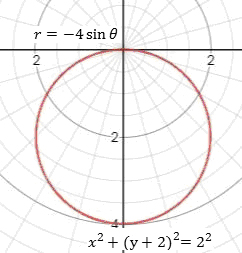
The graph of is the equation of circle with center and radius 2.

Given:
It is asked to transform the polar equation to rectangular coordinates and graph it.
Explanation of Solution
Convert the polar equation to a rectangular equation.
Formula used:
Consider ,
Multiply both the sides by ,
Now use completion of square for ‘’.
The above is an equation of circle with center and radius 2.
The graph of is the equation of circle with center and radius 2.
To sketch:
Chapter 9 Solutions
Precalculus
Additional Math Textbook Solutions
A First Course in Probability (10th Edition)
A Problem Solving Approach To Mathematics For Elementary School Teachers (13th Edition)
Pre-Algebra Student Edition
Elementary Statistics: Picturing the World (7th Edition)
Elementary Statistics
Algebra and Trigonometry (6th Edition)


- please do Q3arrow_forwardUse the properties of logarithms, given that In(2) = 0.6931 and In(3) = 1.0986, to approximate the logarithm. Use a calculator to confirm your approximations. (Round your answers to four decimal places.) (a) In(0.75) (b) In(24) (c) In(18) 1 (d) In ≈ 2 72arrow_forwardFind the indefinite integral. (Remember the constant of integration.) √tan(8x) tan(8x) sec²(8x) dxarrow_forward
- Find the indefinite integral by making a change of variables. (Remember the constant of integration.) √(x+4) 4)√6-x dxarrow_forwarda -> f(x) = f(x) = [x] show that whether f is continuous function or not(by using theorem) Muslim_mathsarrow_forwardUse Green's Theorem to evaluate F. dr, where F = (√+4y, 2x + √√) and C consists of the arc of the curve y = 4x - x² from (0,0) to (4,0) and the line segment from (4,0) to (0,0).arrow_forward
- Evaluate F. dr where F(x, y, z) = (2yz cos(xyz), 2xzcos(xyz), 2xy cos(xyz)) and C is the line π 1 1 segment starting at the point (8, ' and ending at the point (3, 2 3'6arrow_forwardCan you help me find the result of an integral + a 炉[メをメ +炉なarrow_forward2 a Can you help me find the result of an integral a 아 x² dxarrow_forward
 Calculus: Early TranscendentalsCalculusISBN:9781285741550Author:James StewartPublisher:Cengage Learning
 Thomas' Calculus (14th Edition)CalculusISBN:9780134438986Author:Joel R. Hass, Christopher E. Heil, Maurice D. WeirPublisher:PEARSON
 Calculus: Early Transcendentals (3rd Edition)CalculusISBN:9780134763644Author:William L. Briggs, Lyle Cochran, Bernard Gillett, Eric SchulzPublisher:PEARSON
 Calculus: Early TranscendentalsCalculusISBN:9781319050740Author:Jon Rogawski, Colin Adams, Robert FranzosaPublisher:W. H. Freeman
 Calculus: Early Transcendental FunctionsCalculusISBN:9781337552516Author:Ron Larson, Bruce H. EdwardsPublisher:Cengage Learning