Concept explainers
Videos
Residual Plot: Miles per Gallon Consider the data of Problem 9.
- (a) Make a residual plot for the least-squares model.
- (b) Use the residual plot to comment about the appropriateness of the least-squares model for these data. See Problem 19.
9. Weight of Car: Miles per Gallon Do heavier cars really use more gasoline? Suppose a car is chosen at random. Let x be the weight of the car (in hundreds of pounds), and let y be the miles per gallon (mpg). The following information is based on data taken from Consumer Reports (Vol. 62, No. 4).
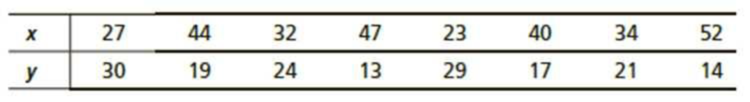
Complete parts (a) through (e), given ∑x = 299, ∑y = 167, ∑x2 = 11,887, ∑y2 = 3773, ∑xy = 5814, and r ≈ –0.946.
(f) Suppose a car weighs x = 38 (hundred pounds). What does the least-squares line forecast for y = miles per gallon?
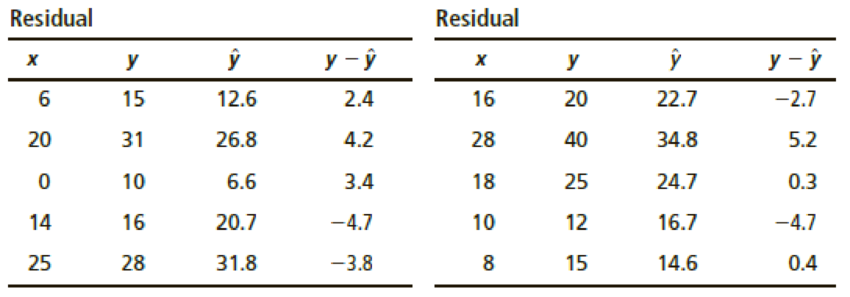
Expand Your Knowledge: Residual Plot The least-squares line usually does not go through all the sample data points (x, y). In fact, for a specified x value from a data pair (x, y), there is usually a difference between the predicted value and the y value paired with x. This difference is called the residual.
The residual is the difference between the y value in a specified data pair (x, y) and the value
One way to assess how well a least-squares line serves as a model for the data is a residual plot. To make a residual plot, we put the x values in order on the horizontal axis and plot the corresponding residuals
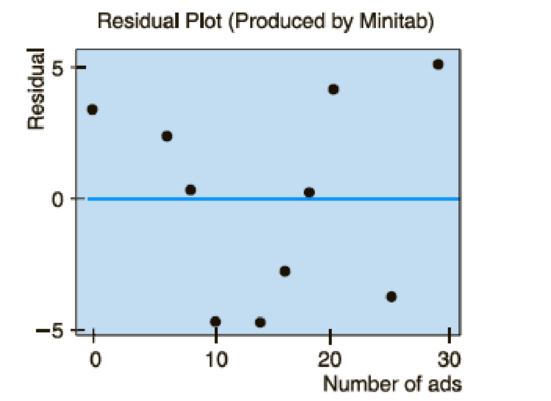
- (a) If the least-squares line provides a reasonable model for the data, the pattern of points in the plot will seem random and unstructured about the horizontal line at 0. Is this the case for the residual plot?
- (b) If a point on the residual plot seems far outside the pattern of other points, it might reflect an unusual data point (x, y), called an outlier. Such points may have quite an influence on the least-squares model. Do there appear to be any outliers in the data for the residual plot?
Want to see the full answer?
Check out a sample textbook solution
Chapter 9 Solutions
Bundle: Understandable Statistics, Loose-leaf Version, 12th + WebAssign Printed Access Card for Brase/Brase's Understandable Statistics: Concepts and Methods, 12th Edition, Single-Term


- A marketing agency wants to determine whether different advertising platforms generate significantly different levels of customer engagement. The agency measures the average number of daily clicks on ads for three platforms: Social Media, Search Engines, and Email Campaigns. The agency collects data on daily clicks for each platform over a 10-day period and wants to test whether there is a statistically significant difference in the mean number of daily clicks among these platforms. Conduct ANOVA test. You can provide your answer by inserting a text box and the answer must include: also please provide a step by on getting the answers in excel Null hypothesis, Alternative hypothesis, Show answer (output table/summary table), and Conclusion based on the P value.arrow_forwardA company found that the daily sales revenue of its flagship product follows a normal distribution with a mean of $4500 and a standard deviation of $450. The company defines a "high-sales day" that is, any day with sales exceeding $4800. please provide a step by step on how to get the answers Q: What percentage of days can the company expect to have "high-sales days" or sales greater than $4800? Q: What is the sales revenue threshold for the bottom 10% of days? (please note that 10% refers to the probability/area under bell curve towards the lower tail of bell curve) Provide answers in the yellow cellsarrow_forwardBusiness Discussarrow_forward
- The following data represent total ventilation measured in liters of air per minute per square meter of body area for two independent (and randomly chosen) samples. Analyze these data using the appropriate non-parametric hypothesis testarrow_forwardeach column represents before & after measurements on the same individual. Analyze with the appropriate non-parametric hypothesis test for a paired design.arrow_forwardShould you be confident in applying your regression equation to estimate the heart rate of a python at 35°C? Why or why not?arrow_forward
 Functions and Change: A Modeling Approach to Coll...AlgebraISBN:9781337111348Author:Bruce Crauder, Benny Evans, Alan NoellPublisher:Cengage Learning
 Linear Algebra: A Modern IntroductionAlgebraISBN:9781285463247Author:David PoolePublisher:Cengage Learning
 Algebra & Trigonometry with Analytic GeometryAlgebraISBN:9781133382119Author:SwokowskiPublisher:Cengage
 College AlgebraAlgebraISBN:9781305115545Author:James Stewart, Lothar Redlin, Saleem WatsonPublisher:Cengage Learning
 Algebra and Trigonometry (MindTap Course List)AlgebraISBN:9781305071742Author:James Stewart, Lothar Redlin, Saleem WatsonPublisher:Cengage Learning