
(a)
Interpretation:
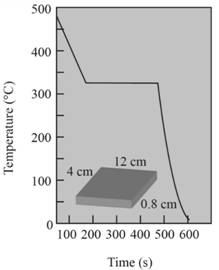
Pouring temperature in the cooling curve needs to be determined.
Concept Introduction:
The cooling curve represents a changein temperature as a function of time.
Cooling curves are of two types of metal- for metal with no inoculation and for metal with inoculation.
Cooling curve represents different temperatures.
Answer to Problem 9.62P
Pouring temperature is
Explanation of Solution
Pouring temperature is the temperature of the liquid at which it is added in the mold.
Hence from the graph shown, temperature is
(b)
Interpretation:
The solidification temperature of the metal in cooling curves needs to be determined
Concept Introduction:
Solidification is a process of forming crystal structure from the molten metal during cooling.
The temperature at which molten metal starts forming crystal is solidification temperature.
Answer to Problem 9.62P
Solidification temperature of metal is
Explanation of Solution
Solidification temperature at which the solidification starts.Hence from the graph, the solidification temperature is
Thus,
(c)
Interpretation:
The superheat temperature of the metal needs to be determined.
Concept Introduction:
Difference between pouring temperature and freezing temperature is known as superheating.
Pouring temperature is the temperature at which metal is introduced in a casting.
Freezing temperature is the temperature at which metal solidifies.
Answer to Problem 9.62P
Superheat temperature is
Explanation of Solution
Superheat is a temperature between pouring temperature and freezing temperature.
Pouring temperature,
Freezing temperature,
(d)
Interpretation:
The cooling rate at the starting of solidification needs to be determined.
Concept Introduction:
Cooling curves are of two types of metal- for metal with no inoculation and for metal with inoculation.
Cooling curve represents different temperatures.
The cooling curve shows the different regions according to the change in temperature at a specific time.
Answer to Problem 9.62P
Cooling rate of metal is
Explanation of Solution
The cooling rate is the rate of change in temperature with respect to time.
According to the graph,the slope of the curve from pouring temperature to freezing temperature shows the rate of cooling.
It is denoted by
Cooling rate
(e)
Interpretation:
The total solidification time needs to be determined.
Concept Introduction:
Solidification is a process of forming crystal structure from molten metal during cooling. The time required to form crystal structure from the molten metal is solidification time.
Answer to Problem 9.62P
Total solidification time of metal is
Explanation of Solution
The time required to remove the specific heat and the latent heat of fusion during cooling of metal is total solidification time.It is the time between the pouring of metal to the completion of solidification.
From the graph,
(f)
Interpretation:
The local solidification time of metal needs to be determined.
Concept Introduction:
Solidification is a process of forming crystal structure from molten metal during cooling. The time required to form crystal structure from molten metal is called solidification time.
Answer to Problem 9.62P
Local solidification time of metal is 340 sec.
Explanation of Solution
The time required to remove the latent heat of fusion at a specific casting location is local solidification time.It is the time between the start of solidification and the end of solidification.
Hence from the graph,
(g)
Interpretation:
The undercooling in the cooling curve needs to be determined.
Concept Introduction:
There are mainly two types of the cooling curve, when metal is well inoculated and when metal is not well inoculated.
Answer to Problem 9.62P
There is no undercooling in the cooling curve.
Explanation of Solution
Liquids don't have nucleating assent.Homogeneous nucleation takes place in B-C region.For cooling curve when the metal is well inoculated, undercooling is not necessary.Solidification starts at melting temperature.
(h)
Interpretation:
The identity of metal needs to be stated.
Concept Introduction:
Cooling curves are of two types of metal- for metal with no inoculation and for metal with inoculation.
Cooling curve represents different temperatures.The cooling curve represents a change in temperature as a function of time.
Answer to Problem 9.62P
Probably the metal should be cadmium.
Explanation of Solution
Given the cooling curve is for metal having well inoculation.For this metal, solidification starts at melting temperature.Solidification of the temperature of this metal is
Hence the probable metal should be cadmium.
(i)
Interpretation:
Mold constant of metal needs to be determined.
Concept Introduction:
As per Chvorinov's rule, solidification time is directly proportional to the square of volume- area ratio of the cast metal.
Here,
Answer to Problem 9.62P
Mold constant is
Explanation of Solution
As per Chvorinov's rule,
Volume of casting can be calculated as follows:
Area of casting can be calculated as follows:
Thus,
Want to see more full solutions like this?
Chapter 9 Solutions
Essentials of Materials Science and Engineering, SI Edition

- 1. The figure shows a car jack to support 400kg (W=400kg). In the drawing, the angle (0) varies between 15 and 70 °. The links are machined from AISI 1020 hot-rolled steel bars with a minimum yield strength of 380MPa. Each link consists of two bars, one on each side of the central bearings. The bars are 300mm in length (/) and 25 mm in width (w). The pinned ends have the buckling constant (C) of 1.4 for out of plane buckling. The design factor (nd) is 2.5. (1) Find the thickness (t) of the bars and the factor of safety (n). (2) Check if the bar is an Euler beam. Darrow_forwardcan you do specific control loop for dc including reboiler and condenserarrow_forward- A 3-phase, 4-wire distributor supplies a balanced voltage of 400/230 V to a load consisting of 8 A at p.f. 0.7 lagging for R-phase, 10 A at p.f. 0-8 leading for Y phase and 12 A at unity p.f. for B phase. The resistance of each line conductor is 0.4 2. The reactance of neutral is 0.2 2. Calculate the neutral current, the supply voltage for R phase and draw the phasor diagram. The phase sequence is RYB.arrow_forward
- No AI WILL REJECTarrow_forwardCan you please do with hand calcs and answer the following: a Determine the global stiffness matrix (K) of the beam including indicating correct degrees-of freedom (dof) b i) Calculate vectors D and Q ii) Show partition and solve KD=Q for D iii) Calculate all reactions c BMD & max BM, deflected shape d i) Solve the problem using Strand7 (model) ii) Display the deflected shape and BMD e Comparisons of reactions + Max BM including commentsarrow_forward(Read image)arrow_forward
- I want to solve 13.2 using matlab please helparrow_forwarda) Show a possible trace of the OSPF algorithm for computing the routing table in Router 2 forthis network.b) Show the messages used by RIP to compute routing tables.arrow_forwardUNIVERSIDAD NACIONAL DE SAN ANTONIO ABAD DEL CUSCO PRIMER EXAMEN PARCIAL DE MECÁNICA DE FLUIDOS I ............ Cusco, 23 de setiembre de 2024 AP. Y NOMBRES: ........ 1.- Para el tanque de la figura: a) Calcule la profundidad de la hidrolina si la profundidad del agua es de 2.8 m y el medidor del fondo del tanque da una lectura de 52.3kPa. b) Calcule la profundidad del agua si la profundidad de la hidrolina es 6.90 m y el medidor de la parte inferior del tanque registra una lectura de 125.3 kPa. Hidrolina Sp=0.90 Abertura Agua sup suge to but amulor quit y 2.- Calcule la magnitud de la fuerza resultante sobre el área A-B y la ubicación del centro de presión. Señale la fuerza resultante sobre el área y dimensione su ubicación con claridad. 3.5 ft 12 in: Oil (38-0.93) 14 in 8 inarrow_forward
- using r language to answer question 4 Question 4: Obtain a 95% standard normal bootstrap confidence interval, a 95% basic bootstrap confidence interval, and a percentile confidence interval for the ρb12 in Question 3.arrow_forwardplease solve this problem and give me the correct answer step by steparrow_forwardplease solve this problem step by step and show the best way that can be explainedarrow_forward
 MATLAB: An Introduction with ApplicationsEngineeringISBN:9781119256830Author:Amos GilatPublisher:John Wiley & Sons Inc
 Essentials Of Materials Science And EngineeringEngineeringISBN:9781337385497Author:WRIGHT, Wendelin J.Publisher:Cengage,
 Industrial Motor ControlEngineeringISBN:9781133691808Author:Stephen HermanPublisher:Cengage Learning
 Basics Of Engineering EconomyEngineeringISBN:9780073376356Author:Leland Blank, Anthony TarquinPublisher:MCGRAW-HILL HIGHER EDUCATION
 Structural Steel Design (6th Edition)EngineeringISBN:9780134589657Author:Jack C. McCormac, Stephen F. CsernakPublisher:PEARSON
 Fundamentals of Materials Science and Engineering...EngineeringISBN:9781119175483Author:William D. Callister Jr., David G. RethwischPublisher:WILEY