
Concept explainers
Videos
Ethical Behavior of Business Students at Bayview University
During the global recession of 2008 and 2009, there were many accusations of unethical behavior by Wall Street executives, financial managers, and other corporate officers. At that time, an article appeared that suggested that part of the reason for such unethical business behavior may stem from the fact that cheating has become more prevalent among business students (Chronicle of Higher Education, February 10, 2009). The article reported that 56% of business students admitted to cheating at some time during their academic career as compared to 47% of nonbusiness students.
Cheating has been a concern of the dean of the College of Business at Bayview University for several years. Some faculty members in the college believe that cheating is more widespread at Bayview than at other universities, while other faculty members think that cheating is not a major problem in the college. To resolve some of these issues, the dean commissioned a study to assess the current ethical behavior of business students at Bay-view. As part of this study, an anonymous exit survey was administered to a sample of 90 business students from this year’s graduating class. Responses to the following questions were used to obtain data regarding three types of cheating.
During your time at Bayview, did you ever present work copied off the Internet as your own?
Yes ______ No ______
During your time at Bayview, did you ever copy answers off another student’s exam?
Yes ________ No _______
During your time at Bayview, did you ever collaborate with other students on projects that were supposed to be completed individually?
Yes ________ No _______
Any student who answered Yes to one or more of these questions was considered to have been involved in some type of cheating. A portion of the data collected follows. The complete data set is in the file named Bayview.
| Student | Copied from Internet | Copied on Exam | Collaborated on Individual project | Gender |
| 1 | No | No | No | Female |
| 2 | No | No | No | Male |
| 3 | Yes | No | Yes | Male |
| 4 | Yes | Yes | No | Male |
| 5 | No | No | Yes | Male |
| 6 | Yes | No | No | Female |
| . | . | . | . | . |
| . | . | . | . | . |
| 88 | No | No | No | Male |
| 89 | No | Yes | Yes | Male |
| 90 | No | No | No | Female |
Managerial Report
Prepare a report for the dean of the college that summarizes your assessment of the nature of cheating by business students at Bayview University. Be sure to include the following items in your report.
- 1. Use
descriptive statistics to summarize the data and comment on your findings. - 2. Develop 95% confidence intervals for the proportion of all students, the proportion of male students, and the proportion of female students who were involved in some type of cheating.
- 3. Conduct a hypothesis test to determine if the proportion of business students at Bayview University who were involved in some type of cheating is less than that of business students at other institutions as reported by the Chronicle of Higher Education.
- 4. Conduct a hypothesis test to determine if the proportion of business students at Bay-view University who were involved in some form of cheating is less than that of non-business students at other institutions as reported by the Chronicle of higher Education.
- 5. What advice would you give to the dean based upon your analysis of the data?
1.
Summarize the data and comment on your findings using the descriptive statistics.
Answer to Problem 2CP
The percentage of males is greater in Copied from Internet, Copied on Exam, and Collaborated on Individual Project compared to females.
Explanation of Solution
Calculation:
The given data is based on the assessment of the nature of cheating by a business student at Bayview University.
Software procedure:
A step-by-step procedure to construct a contingency table or cross table for gender and Copied from Internet using MINITAB software given below:
- Choose stat > tables>cross tabulation and chi square.
- Choose raw data (summarized).
- In rows, enter the column of Gender.
- In columns, enter the column of Copied from Internet.
- Under display, select count
- Click OK
Output using MINITAB software is given below:
Software procedure:
A step-by-step procedure to construct a contingency table or cross table for gender and Copied on Exam using MINITAB software given below:
- Choose stat > tables>cross tabulation and chi square.
- Choose raw data (summarized).
- In rows, enter the column of Gender.
- In columns, enter the column of Copied on Exam.
- Under display, select count
- Click OK
Output using MINITAB software is given below:
Software procedure:
A step-by-step procedure to construct a contingency table or cross table for gender and Collaborated on Individual Project using MINITAB software given below:
- Choose stat > tables>cross tabulation and chi square.
- Choose raw data (summarized).
- In rows, enter the column of Gender.
- In columns, enter the column of Collaborated on Individual Project.
- Under display, select count
- Click OK
Output using MINITAB software is given below:
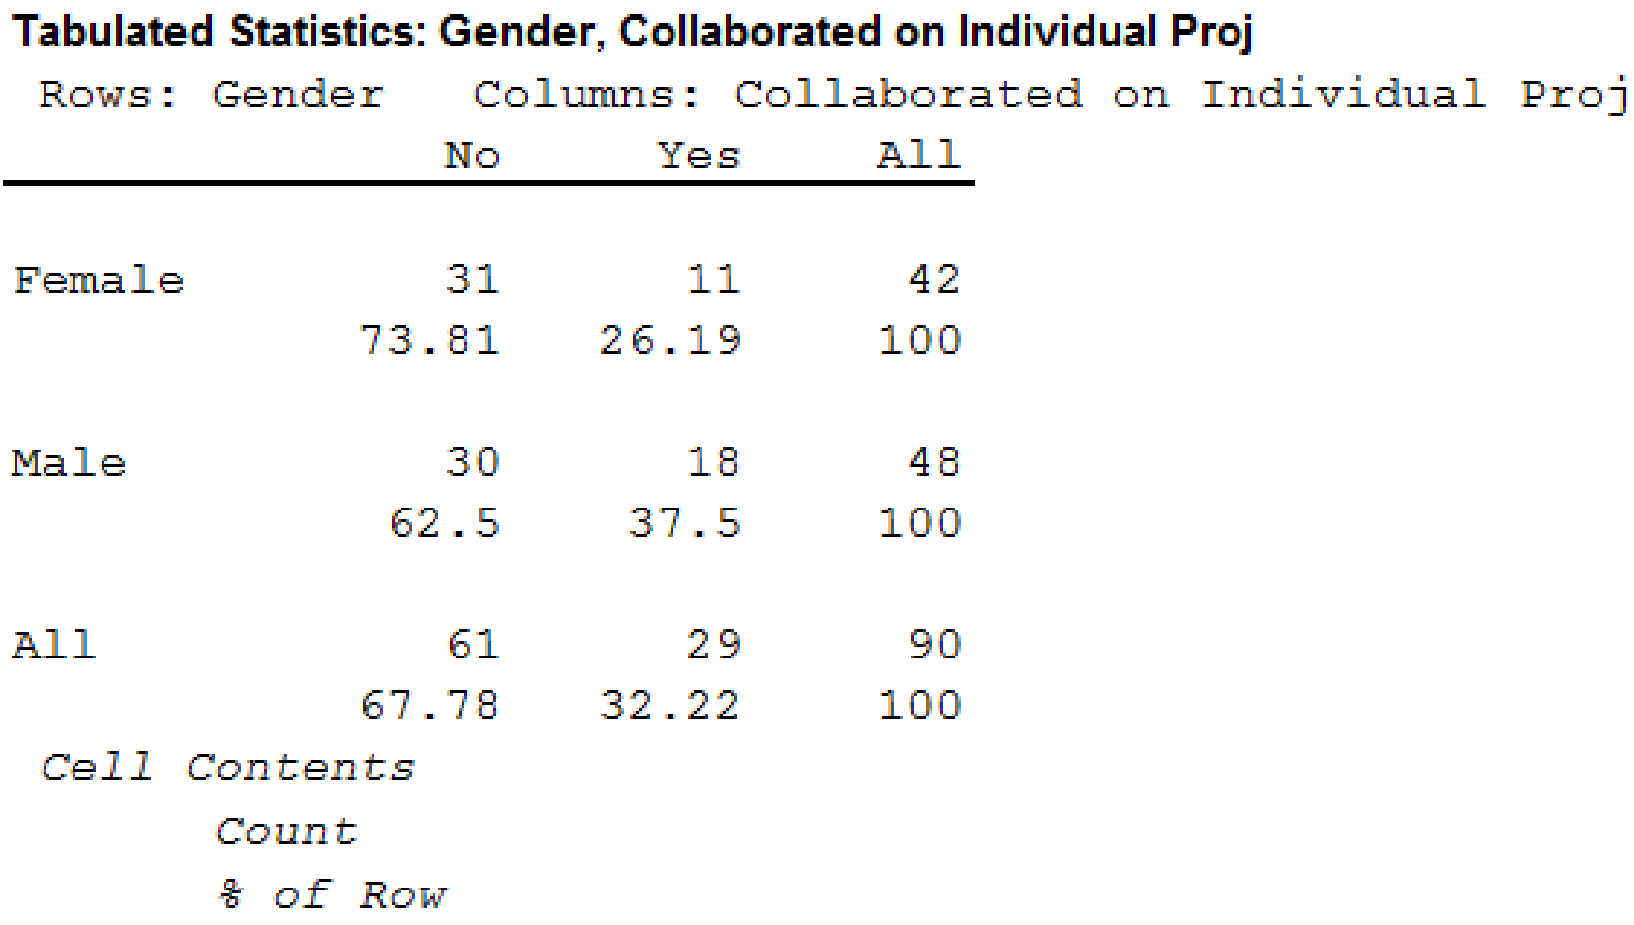
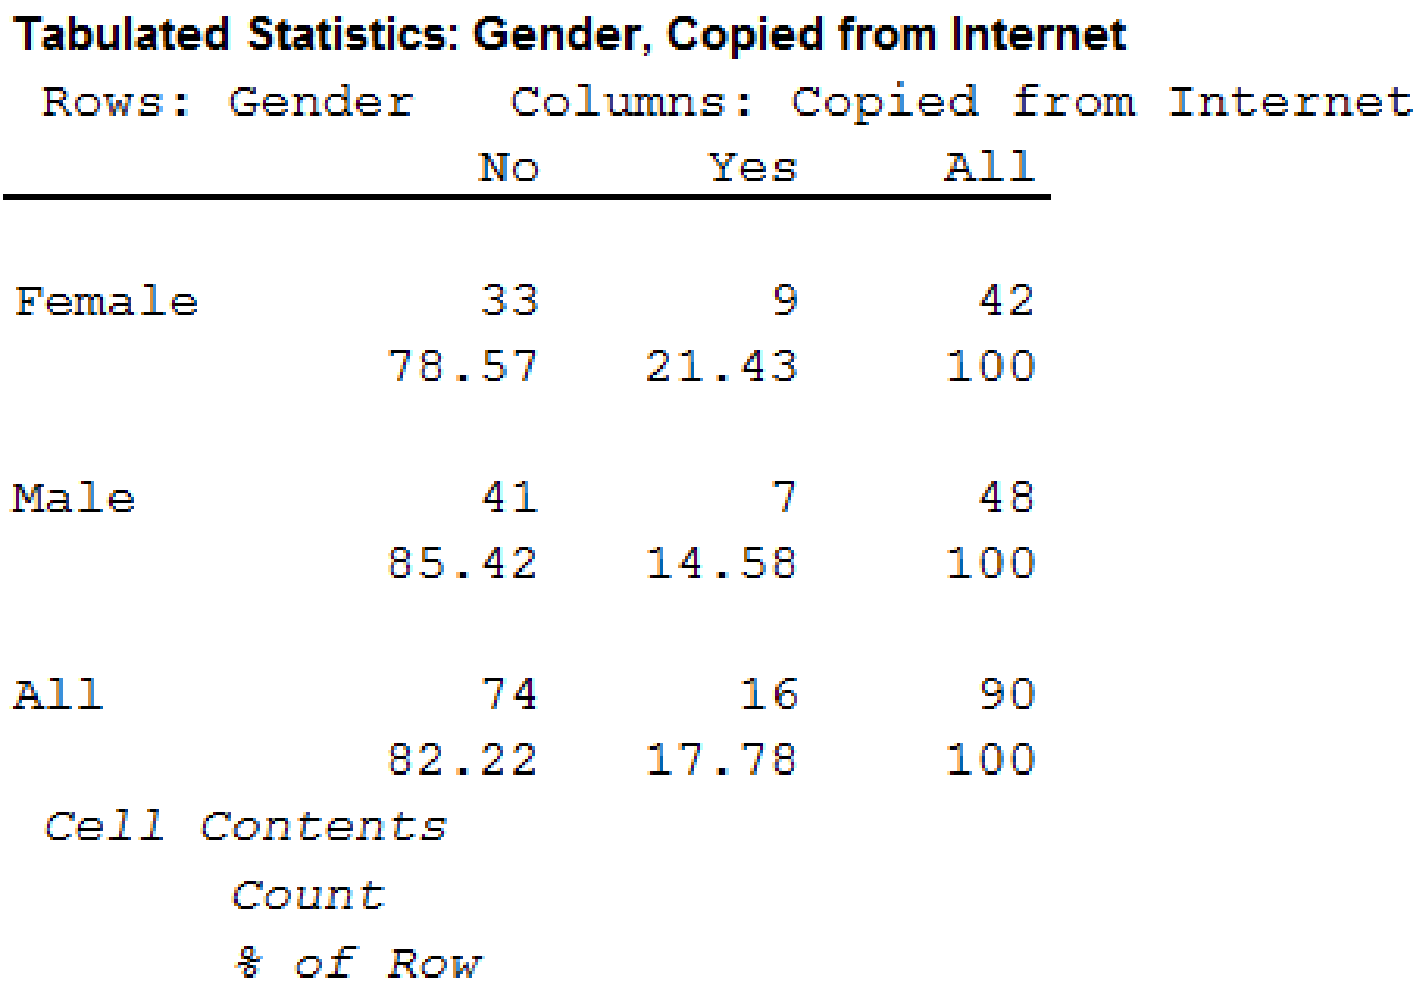
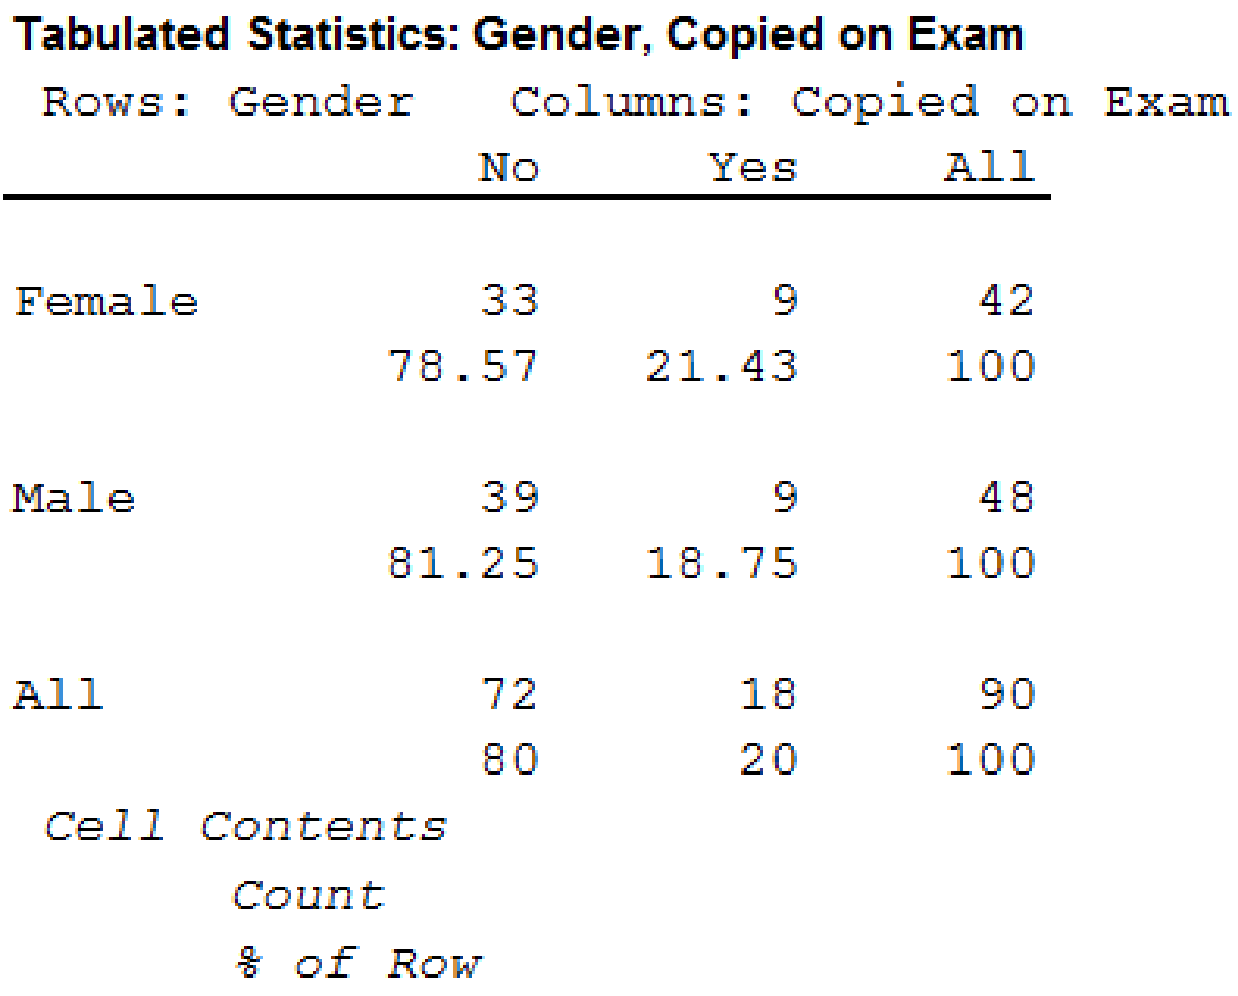
From the results, the summary table for all students who were involved in type of cheating is shown below:
| Copied from Internet | Copied on Exam | Collaborated on Individual Project | Overall Cheated | |||||
| Count | % | Count | % | Count | % | Count | % | |
| Yes | 16 | 17.778 | 18 | 20 | 29 | 32.222 | 37 | 41.111 |
| No | 74 | 82.222 | 72 | 80 | 61 | 67.778 | 53 | 58.889 |
| 90 | 100 | 90 | 100 | 90 | 100 | 90 | 100 | |
From the results, the summary table for male students who were involved in type of cheating is shown below:
| Copied from Internet | Copied on Exam | Collaborated on Individual Project | Overall Cheated | |||||
| Count | % | Count | % | Count | % | Count | % | |
| Yes | 7 | 14.583 | 9 | 18.75 | 18 | 37.5 | 21 | 43.75 |
| No | 41 | 85.417 | 39 | 81.25 | 30 | 62.5 | 27 | 56.25 |
| 48 | 100 | 48 | 100 | 48 | 100 | 48 | 100 | |
From the results, the summary table for female students who were involved in type of cheating is shown below:
| Copied from Internet | Copied on Exam | Collaborated on Individual Project | Overall Cheated | |||||
| Count | % | Count | % | Count | % | Count | % | |
| Yes | 9 | 21.428 | 9 | 21.428 | 11 | 26.190 | 16 | 38.095 |
| No | 33 | 78.571 | 33 | 78.571 | 31 | 73.810 | 26 | 61.905 |
| 42 | 100 | 42 | 100 | 42 | 100 | 42 | 100 | |
Observation:
From the MINITAB output, the percentage of males is greater in Copied from Internet, Copied on Exam, and Collaborated on Individual Project compared to females.
2.
Find the 95% confidence intervals for the proportion of all students who were involved in some type of cheating.
Find the 95% confidence intervals for the proportion of male students who were involved in some type of cheating.
Find the 95% confidence intervals for the proportion of female students who were involved in some type of cheating.
Answer to Problem 2CP
The 95% confidence intervals for the proportion of all students who were involved in some type of cheating is
The 95% confidence intervals for the proportion of male students who were involved in some type of cheating is
The 95% confidence intervals for the proportion of female students who were involved in some type of cheating is
Explanation of Solution
Calculation:
Confidence interval:
Software Procedure:
A step-by-step procedure to obtain the confidence interval using MINITAB software:
- Choose Stat > Basic Statistics > 1 Proportion.
- Choose Summarized data.
- In Number of events, enter 37. In Number of trials, enter 90.
- Check Options; enter Confidence level as 95%.
- Choose not equal in alternative.
- Click OK.
Output using MINITAB software is given below:
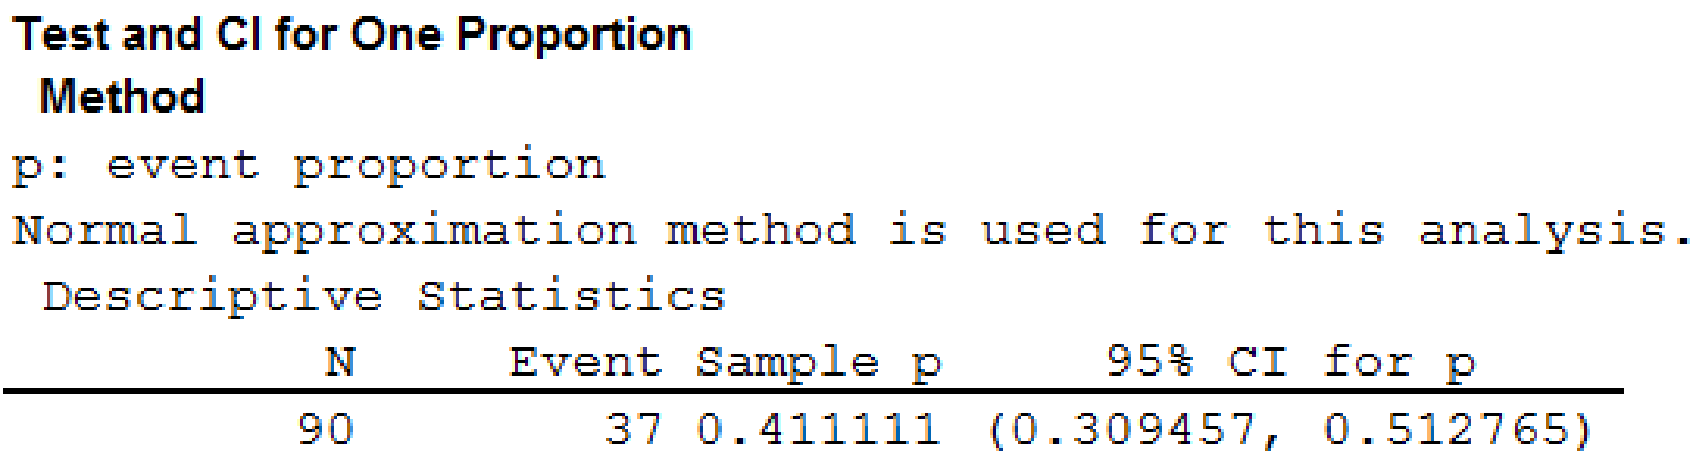
From the output, the 95% confidence intervals for the proportion of all students who were involved in some type of cheating is
Confidence interval:
Software Procedure:
A step-by-step procedure to obtain the confidence interval using MINITAB software:
- Choose Stat > Basic Statistics > 1 Proportion.
- Choose Summarized data.
- In Number of events, enter 21. In Number of trials, enter 48.
- Check Options; enter Confidence level as 95%.
- Choose not equal in alternative.
- Click OK.
Output using MINITAB software is given below:
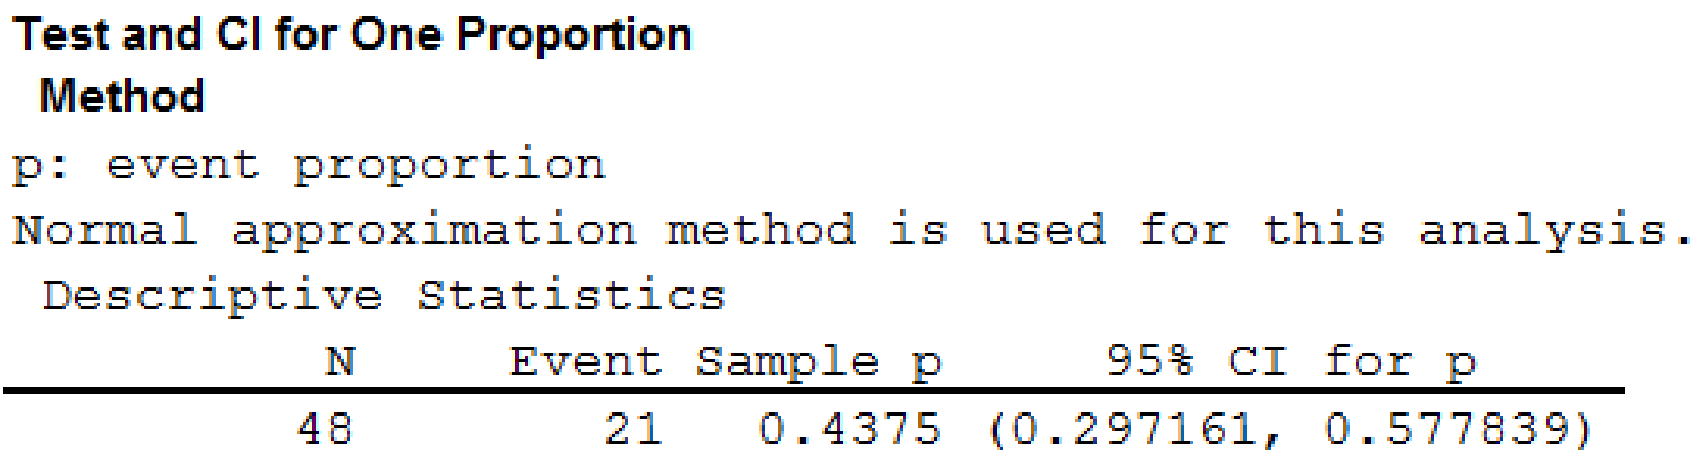
From the output, the 95% confidence intervals for the proportion of male students who were involved in some type of cheating is
Confidence interval:
Software Procedure:
A step-by-step procedure to obtain the confidence interval using MINITAB software:
- Choose Stat > Basic Statistics > 1 Proportion.
- Choose Summarized data.
- In Number of events, enter 16. In Number of trials, enter 42.
- Check Options; enter Confidence level as 95%.
- Choose not equal in alternative.
- Click OK.
Output using MINITAB software is given below:
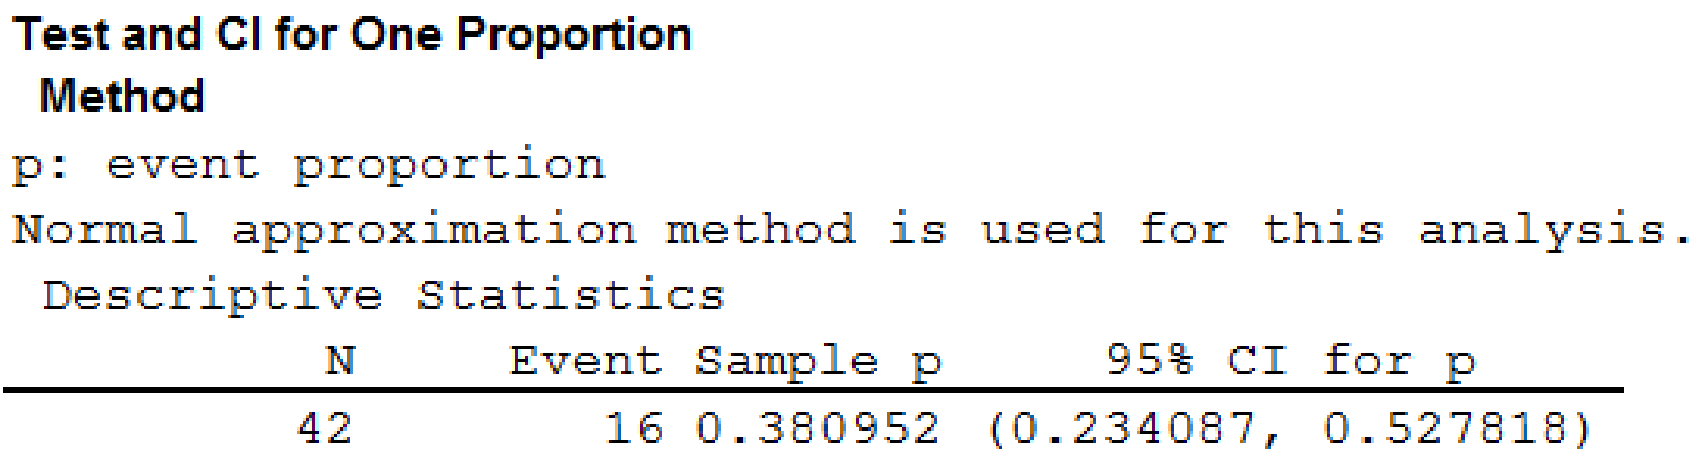
From the output, the 95% confidence intervals for the proportion of female students who were involved in some type of cheating is
3.
Check whether the proportion of business students at Bayview University who were involved in some type of cheating is less than that of business students at other institutions as reported by the Chronicle of Higher Education.
Answer to Problem 2CP
The conclusion is that the proportion of business students at Bayview University who were involved in some type of cheating is less than that of business students at other institutions as reported by the Chronicle of Higher Education.
Explanation of Solution
Calculation:
The null and alternative hypotheses are given below:
Null hypothesis:
Alternative hypothesis:
Software Procedure:
A step-by-step procedure to obtain the p-value using MINITAB software:
- Choose Stat > Basic Statistics > 1 Proportion.
- Choose Summarized data.
- In Number of events, enter 37. In Number of trials, enter 90.
- In Perform hypothesis test, enter the test proportion as 0.56.
- Check Options; enter Confidence level as 95%.
- Choose less than in alternative.
- Click OK.
Output using MINITAB software is given below:
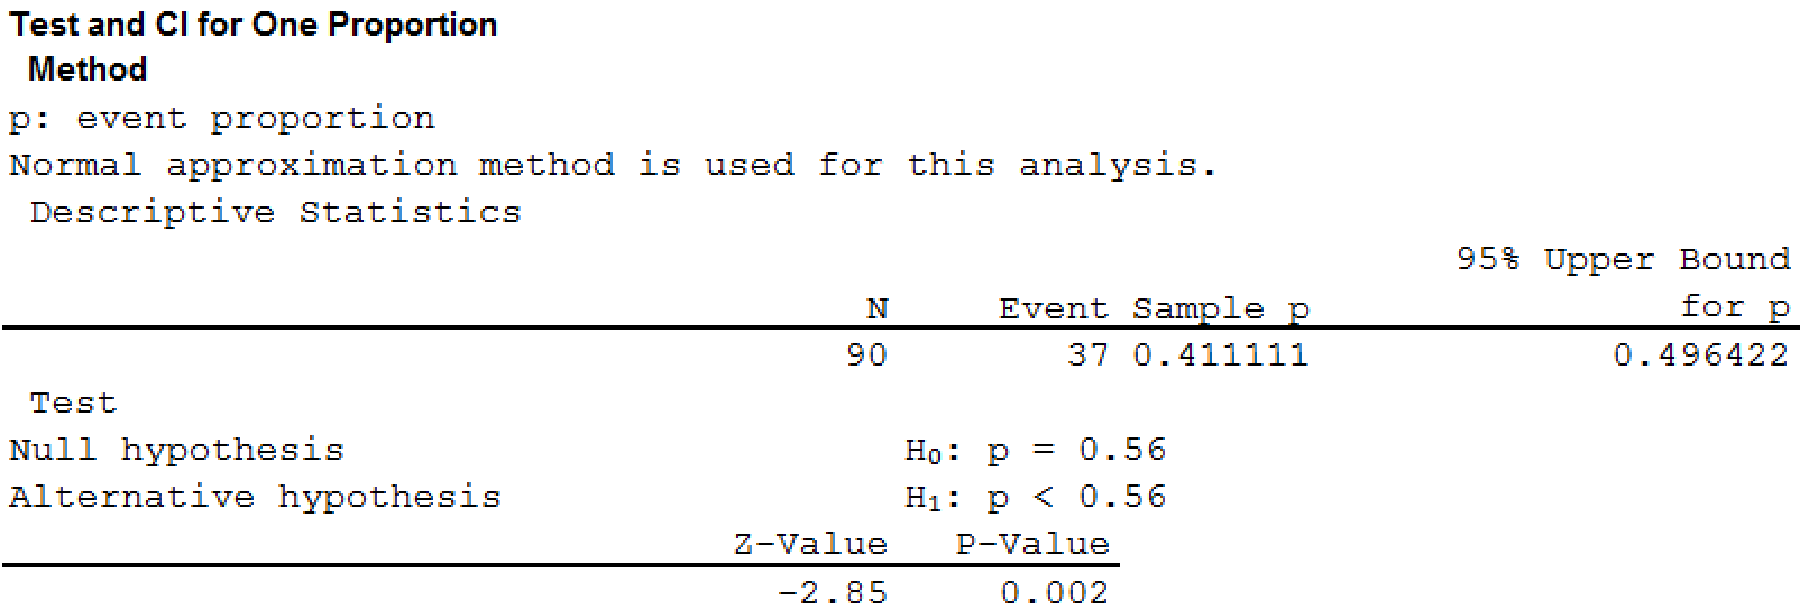
From the output, the p-value is 0.002.
Rejection rule:
If
If
Conclusion:
Here, the p-value is less than the level of significance.
That is,
By the rejection rule, the null hypothesis is rejected.
Hence, the proportion of business students at Bayview University who were involved in some type of cheating is less than that of business students at other institutions as reported by the Chronicle of Higher Education.
4.
Check whether the proportion of business students at Bayview University who were involved in some form of cheating is less than that of non-business students at other institutions as reported by the Chronicle of Higher Education.
Answer to Problem 2CP
The conclusion is that the proportion of business students at Bayview University who were involved in some form of cheating is not less than that of non-business students at other institutions as reported by the Chronicle of Higher Education.
Explanation of Solution
Calculation:
The null and alternative hypotheses most appropriate for this situation are shown below:
Null hypothesis:
Alternative hypothesis:
Software Procedure:
A step-by-step procedure to obtain the p-value using MINITAB software:
- Choose Stat > Basic Statistics > 1 Proportion.
- Choose Summarized data.
- In Number of events, enter 37. In Number of trials, enter 90.
- In Perform hypothesis test, enter the test proportion as 0.47.
- Check Options; enter Confidence level as 95%.
- Choose less than in alternative.
- Click OK.
Output using MINITAB software is given below:
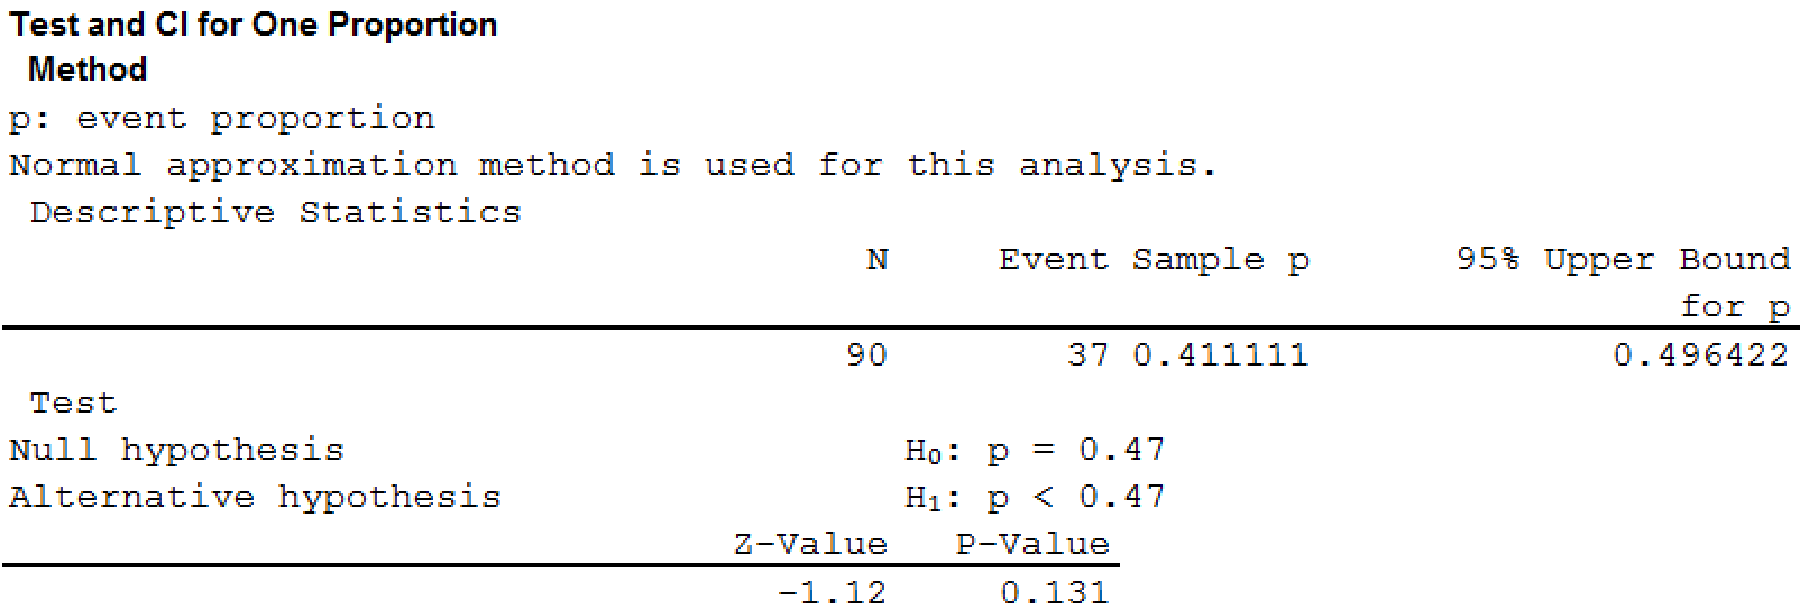
From the output, the p-value is 0.131.
Rejection rule:
If
If
Conclusion:
Here, the p-value is greater than the level of significance.
That is,
By the rejection rule, the null hypothesis is not rejected.
Hence, the proportion of business students at Bayview University who were involved in some form of cheating is not less than that of non-business students at other institutions as reported by the Chronicle of Higher Education.
5.
Find the advice that you give to the dean based upon your analysis of the data.
Explanation of Solution
From the results, it can be observed that the business students at Bayview University who were involved in some form of cheating are higher when compared to the non-business students. Hence, the dean identifies the reason that the student cannot handle the exam without cheating.
Want to see more full solutions like this?
Chapter 9 Solutions
Essentials of Statistics for Business and Economics


- You find out that the dietary scale you use each day is off by a factor of 2 ounces (over — at least that’s what you say!). The margin of error for your scale was plus or minus 0.5 ounces before you found this out. What’s the margin of error now?arrow_forwardSuppose that Sue and Bill each make a confidence interval out of the same data set, but Sue wants a confidence level of 80 percent compared to Bill’s 90 percent. How do their margins of error compare?arrow_forwardSuppose that you conduct a study twice, and the second time you use four times as many people as you did the first time. How does the change affect your margin of error? (Assume the other components remain constant.)arrow_forward
- Out of a sample of 200 babysitters, 70 percent are girls, and 30 percent are guys. What’s the margin of error for the percentage of female babysitters? Assume 95 percent confidence.What’s the margin of error for the percentage of male babysitters? Assume 95 percent confidence.arrow_forwardYou sample 100 fish in Pond A at the fish hatchery and find that they average 5.5 inches with a standard deviation of 1 inch. Your sample of 100 fish from Pond B has the same mean, but the standard deviation is 2 inches. How do the margins of error compare? (Assume the confidence levels are the same.)arrow_forwardA survey of 1,000 dental patients produces 450 people who floss their teeth adequately. What’s the margin of error for this result? Assume 90 percent confidence.arrow_forward
- The annual aggregate claim amount of an insurer follows a compound Poisson distribution with parameter 1,000. Individual claim amounts follow a Gamma distribution with shape parameter a = 750 and rate parameter λ = 0.25. 1. Generate 20,000 simulated aggregate claim values for the insurer, using a random number generator seed of 955.Display the first five simulated claim values in your answer script using the R function head(). 2. Plot the empirical density function of the simulated aggregate claim values from Question 1, setting the x-axis range from 2,600,000 to 3,300,000 and the y-axis range from 0 to 0.0000045. 3. Suggest a suitable distribution, including its parameters, that approximates the simulated aggregate claim values from Question 1. 4. Generate 20,000 values from your suggested distribution in Question 3 using a random number generator seed of 955. Use the R function head() to display the first five generated values in your answer script. 5. Plot the empirical density…arrow_forwardFind binomial probability if: x = 8, n = 10, p = 0.7 x= 3, n=5, p = 0.3 x = 4, n=7, p = 0.6 Quality Control: A factory produces light bulbs with a 2% defect rate. If a random sample of 20 bulbs is tested, what is the probability that exactly 2 bulbs are defective? (hint: p=2% or 0.02; x =2, n=20; use the same logic for the following problems) Marketing Campaign: A marketing company sends out 1,000 promotional emails. The probability of any email being opened is 0.15. What is the probability that exactly 150 emails will be opened? (hint: total emails or n=1000, x =150) Customer Satisfaction: A survey shows that 70% of customers are satisfied with a new product. Out of 10 randomly selected customers, what is the probability that at least 8 are satisfied? (hint: One of the keyword in this question is “at least 8”, it is not “exactly 8”, the correct formula for this should be = 1- (binom.dist(7, 10, 0.7, TRUE)). The part in the princess will give you the probability of seven and less than…arrow_forwardplease answer these questionsarrow_forward
- Selon une économiste d’une société financière, les dépenses moyennes pour « meubles et appareils de maison » ont été moins importantes pour les ménages de la région de Montréal, que celles de la région de Québec. Un échantillon aléatoire de 14 ménages pour la région de Montréal et de 16 ménages pour la région Québec est tiré et donne les données suivantes, en ce qui a trait aux dépenses pour ce secteur d’activité économique. On suppose que les données de chaque population sont distribuées selon une loi normale. Nous sommes intéressé à connaitre si les variances des populations sont égales.a) Faites le test d’hypothèse sur deux variances approprié au seuil de signification de 1 %. Inclure les informations suivantes : i. Hypothèse / Identification des populationsii. Valeur(s) critique(s) de Fiii. Règle de décisioniv. Valeur du rapport Fv. Décision et conclusion b) A partir des résultats obtenus en a), est-ce que l’hypothèse d’égalité des variances pour cette…arrow_forwardAccording to an economist from a financial company, the average expenditures on "furniture and household appliances" have been lower for households in the Montreal area than those in the Quebec region. A random sample of 14 households from the Montreal region and 16 households from the Quebec region was taken, providing the following data regarding expenditures in this economic sector. It is assumed that the data from each population are distributed normally. We are interested in knowing if the variances of the populations are equal. a) Perform the appropriate hypothesis test on two variances at a significance level of 1%. Include the following information: i. Hypothesis / Identification of populations ii. Critical F-value(s) iii. Decision rule iv. F-ratio value v. Decision and conclusion b) Based on the results obtained in a), is the hypothesis of equal variances for this socio-economic characteristic measured in these two populations upheld? c) Based on the results obtained in a),…arrow_forwardA major company in the Montreal area, offering a range of engineering services from project preparation to construction execution, and industrial project management, wants to ensure that the individuals who are responsible for project cost estimation and bid preparation demonstrate a certain uniformity in their estimates. The head of civil engineering and municipal services decided to structure an experimental plan to detect if there could be significant differences in project evaluation. Seven projects were selected, each of which had to be evaluated by each of the two estimators, with the order of the projects submitted being random. The obtained estimates are presented in the table below. a) Complete the table above by calculating: i. The differences (A-B) ii. The sum of the differences iii. The mean of the differences iv. The standard deviation of the differences b) What is the value of the t-statistic? c) What is the critical t-value for this test at a significance level of 1%?…arrow_forward
 Big Ideas Math A Bridge To Success Algebra 1: Stu...AlgebraISBN:9781680331141Author:HOUGHTON MIFFLIN HARCOURTPublisher:Houghton Mifflin Harcourt
 Glencoe Algebra 1, Student Edition, 9780079039897...AlgebraISBN:9780079039897Author:CarterPublisher:McGraw Hill
 Holt Mcdougal Larson Pre-algebra: Student Edition...AlgebraISBN:9780547587776Author:HOLT MCDOUGALPublisher:HOLT MCDOUGAL
 College Algebra (MindTap Course List)AlgebraISBN:9781305652231Author:R. David Gustafson, Jeff HughesPublisher:Cengage Learning