
(a)
Interpretation:
Refer to the given phase diagram of compound X. The physical state of compound X is to be determined at pressure 35mmHg and temperature -50°C.
Concept introduction:
Phase diagram can be defined as the representation of pressure and temperature quantities of any pure substance. At these values of temperature and pressure, the different phases of the pure substance are equilibrium to each other.
Answer to Problem 17QAP
The physical state of compound X is solid determined at pressure 35mmHg and temperature -50°C.
Explanation of Solution
Given Information:
The phase diagram of compound X is as follows:
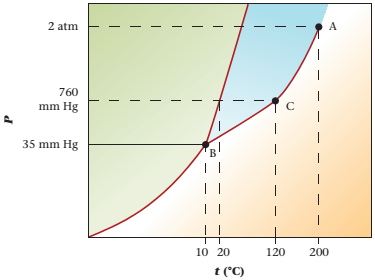
The triple point is defined as the equilibrium condition among all the three phases of any pure substance which is solid, liquid and gas. The curves are used for the equilibrium condition between two phases of pure substance. The phase diagram is shown below-
In the below diagram −
a = solid-liquid phase in equilibrium
b = liquid-vapor phase in equilibrium
c = solid-vapor phase in equilibrium

Given values-
Pressure = 35mmHg
Temperature = -50°C
These two given values are represented in the plot of the phase diagram of compound X. These two quantities are existing at the left of point B.
Hence,
At pressure 35 mmHg and at temperature -50°C, the physical state of the compound is solid.
(b)
Interpretation:
The normal boiling point of a compound is to be determined.
Concept introduction:
Phase diagram can be defined as the representation of pressure and temperature quantities of any pure substance. At these values of temperature and pressure, the different phases of the pure substance are equilibrium to each other.
Answer to Problem 17QAP
The normal boiling point of a compound is 120°C.
Explanation of Solution
The triple point is defined as the equilibrium condition among all the three phases of any pure substance which is solid, liquid and gas. The curves are used for the equilibrium condition between two phases of pure substance. The phase diagram is shown below-

In the above diagram −
a = solid-liquid phase in equilibrium
b = liquid-vapor phase in equilibrium
c = solid-vapor phase in equilibrium
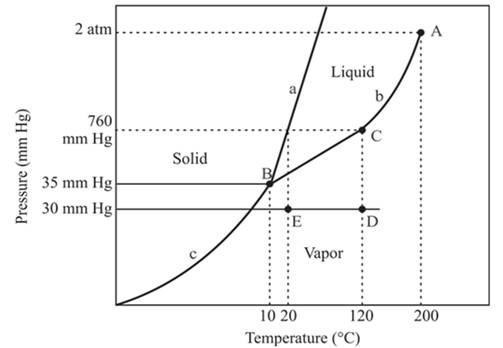
The normal boiling temperature is the temperature at which compound start boiling which is basically atmospheric pressure. Therefore pressure for the boiling point is 760mmHg. At atmospheric pressure of boiling point, if at the particular temperature the liquid and vapor phase of a substance are at equilibrium, then that temperature is the boiling point temperature. From the phase diagram of substance at temperature, 120°C liquid and vapor phase of a substance is at the equilibrium.
Hence, the boiling point temperature is 120°C.
(c)
Interpretation:
The critical point for the compound is to be located.
Concept introduction:
Phase diagram can be defined as the representation of pressure and temperature quantities of any pure substance. At these values of temperature and pressure, the different phases of the pure substance are equilibrium to each other.
Answer to Problem 17QAP
The critical point for the compound is located at point A.
Explanation of Solution
The triple point is defined as the equilibrium condition among all the three phases of any pure substance which is solid, liquid and gas. The curves are used for the equilibrium condition between two phases of water. The phase diagram is shown below-

In the above diagram −
a = solid-liquid phase in equilibrium
b = liquid-vapor phase in equilibrium
c = solid-vapor phase in equilibrium
From the above diagram, the critical point of a substance is represented by the end of that curve which shows the equilibrium condition between the liquid phase and vapor phase. This curve is curved b and it ends at point A at temperature 200°C and at pressure 2 atm.
Hence, the critical point will exist at point A.
(d)
Interpretation:
The triple point for the compound is to be located.
Concept introduction:
Phase diagram can be defined as the representation of pressure and temperature quantities of any pure substance. At these values of temperature and pressure, the different phases of the pure substance are equilibrium to each other.
Answer to Problem 17QAP
The triple point for the compound is located at point B
Explanation of Solution
The triple point is defined as the equilibrium condition among all the three phases of any pure substance which is solid, liquid and gas. The curves are used for the equilibrium condition between two phases of water. The phase diagram is shown below-

In the above diagram −
a = solid-liquid phase in equilibrium
b = liquid-vapor phase in equilibrium
c = solid-vapor phase in equilibrium
The triple point represents the equilibrium among all the phases which are solid, liquid and gas of compound. Hence, the intersection point of all curves a, b and c will represent the triple point. From the graph, the intersection point of these three curves is existing at point B.
Therefore, point B will represent the triple point of the compound.
(e)
Interpretation:
The changes are to be determined at constant pressure 30mmHg and the temperature is changing from 120°C to 20°C.
Concept introduction:
Phase diagram can be defined as the representation of pressure and temperature quantities of any pure substance. At these values of temperature and pressure, the different phases of the pure substance are equilibrium to each other.
Answer to Problem 17QAP
At constant pressure, 30mmHg and the process of changing of temperature from 120°C to 20°C is occurring between point D and E. In this process-
No change in phase.
The density of the vapor phase is high at point E in comparison to point D.
Explanation of Solution
The triple point is defined as the equilibrium condition among all the three phases of any pure substance which is solid, liquid and gas. The curves are used for the equilibrium condition between two phases of water. The phase diagram is shown below-

In the above diagram −
a = solid-liquid phase in equilibrium
b = liquid-vapor phase in equilibrium
c = solid-vapor phase in equilibrium
In this process the, the pressure is constant and the temperature varies from 120°C to 20°C which is represented by point D and E. the starting point D and end point E both are existing in the vapor phase. It means there is no phase change when the temperature is decreasing form 120°C to 20°C. The density of the vapor phase at point E will be increased because it is nearer to the liquid and the solid phase in comparison to point D.
(f)
Interpretation:
The densest phase is to be determined.
Concept introduction:
Phase diagram can be defined as the representation of pressure and temperature quantities of any pure substance. At these values of temperature and pressure, the different phases of the pure substance are equilibrium to each other.
Answer to Problem 17QAP
The densest phase is a solid phase.
Explanation of Solution
The triple point is defined as the equilibrium condition among all the three phases of any pure substance which is solid, liquid and gas. The curves are used for the equilibrium condition between two phases of water. The phase diagram is shown below-
In the above diagram −
a = solid-liquid phase in equilibrium
b = liquid-vapor phase in equilibrium
c = solid-vapor phase in equilibrium
The densest part of this phase diagram is a solid phase because in solid phase all molecules are closely bound and from the diagram, we can see that the solid phase exists at the high temperature and low pressure, therefore, solid phase is the densest phase among all.
Want to see more full solutions like this?
Chapter 9 Solutions
PRINCIPLES+REACTIONS

- Identify and provide a concise explanation of a specific analytical instrument capable of detecting and quantifying trace compounds in food samples. Emphasise the instrumental capabilities relevant to trace compound analysis in the nominated food. Include the specific application name (eg: identification and quantification of mercury in salmon), outline a brief description of sample preparation procedures, and provide a summary of the obtained results from the analytical process.arrow_forwardIdentify and provide an explanation of what 'Seperation Science' is. Also describe its importance with the respect to the chemical analysis of food. Provide specific examples.arrow_forward5. Propose a Synthesis for the molecule below. You may use any starting materials containing 6 carbons or less (reagents that aren't incorporated into the final molecule such as PhзP do not count towards this total, and the starting material can have whatever non-carbon functional groups you want), and any of the reactions you have learned so far in organic chemistry I, II, and III. Your final answer should show each step separately, with intermediates and conditions clearly drawn. H3C CH3arrow_forward
- State the name and condensed formula of isooxazole obtained by reacting acetylacetone and hydroxylamine.arrow_forwardState the name and condensed formula of the isothiazole obtained by reacting acetylacetone and thiosemicarbazide.arrow_forwardProvide the semi-developed formula of isooxazole obtained by reacting acetylacetone and hydroxylamine.arrow_forward
- Given a 1,3-dicarbonyl compound (R1-CO-CH2-CO-R2), indicate the formula of the compound obtaineda) if I add hydroxylamine (NH2OH) to give an isooxazole.b) if I add thiosemicarbazide (NH2-CO-NH-NH2) to give an isothiazole.arrow_forwardAn orange laser has a wavelength of 610 nm. What is the energy of this light?arrow_forwardThe molar absorptivity of a protein in water at 280 nm can be estimated within ~5-10% from its content of the amino acids tyrosine and tryptophan and from the number of disulfide linkages (R-S-S-R) between cysteine residues: Ε280 nm (M-1 cm-1) ≈ 5500 nTrp + 1490 nTyr + 125 nS-S where nTrp is the number of tryptophans, nTyr is the number of tyrosines, and nS-S is the number of disulfide linkages. The protein human serum transferrin has 678 amino acids including 8 tryptophans, 26 tyrosines, and 19 disulfide linkages. The molecular mass of the most dominant for is 79550. Predict the molar absorptivity of transferrin. Predict the absorbance of a solution that’s 1.000 g/L transferrin in a 1.000-cm-pathlength cuvet. Estimate the g/L of a transferrin solution with an absorbance of 1.50 at 280 nm.arrow_forward
- In GC, what order will the following molecules elute from the column? CH3OCH3, CH3CH2OH, C3H8, C4H10arrow_forwardBeer’s Law is A = εbc, where A is absorbance, ε is the molar absorptivity (which is specific to the compound and wavelength in the measurement), and c is concentration. The absorbance of a 2.31 × 10⁻⁵ M solution of a compound is 0.822 at a wavelength of 266 nm in a 1.00-cm cell. Calculate the molar absorptivity at 266 nm.arrow_forwardHow to calculate % of unknown solution using line of best fit y=0.1227x + 0.0292 (y=2.244)arrow_forward
 Chemistry: Principles and ReactionsChemistryISBN:9781305079373Author:William L. Masterton, Cecile N. HurleyPublisher:Cengage Learning
 Principles of Modern ChemistryChemistryISBN:9781305079113Author:David W. Oxtoby, H. Pat Gillis, Laurie J. ButlerPublisher:Cengage Learning
 World of Chemistry, 3rd editionChemistryISBN:9781133109655Author:Steven S. Zumdahl, Susan L. Zumdahl, Donald J. DeCostePublisher:Brooks / Cole / Cengage Learning
 Chemistry: The Molecular ScienceChemistryISBN:9781285199047Author:John W. Moore, Conrad L. StanitskiPublisher:Cengage Learning
 Chemistry: Principles and PracticeChemistryISBN:9780534420123Author:Daniel L. Reger, Scott R. Goode, David W. Ball, Edward MercerPublisher:Cengage Learning
 General Chemistry - Standalone book (MindTap Cour...ChemistryISBN:9781305580343Author:Steven D. Gammon, Ebbing, Darrell Ebbing, Steven D., Darrell; Gammon, Darrell Ebbing; Steven D. Gammon, Darrell D.; Gammon, Ebbing; Steven D. Gammon; DarrellPublisher:Cengage Learning