
(a)
Interpretation:
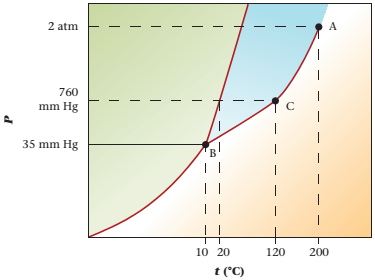
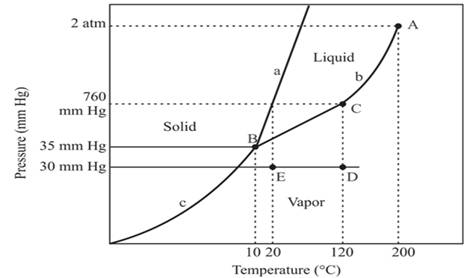
Refer to the given phase diagram of compound X. The physical state of compound X is to be determined at pressure 35mmHg and temperature -50°C.
Concept introduction:
Phase diagram can be defined as the representation of pressure and temperature quantities of any pure substance. At these values of temperature and pressure, the different phases of the pure substance are equilibrium to each other.
Answer to Problem 17QAP
The physical state of compound X is solid determined at pressure 35mmHg and temperature -50°C.
Explanation of Solution
Given Information:
The phase diagram of compound X is as follows:
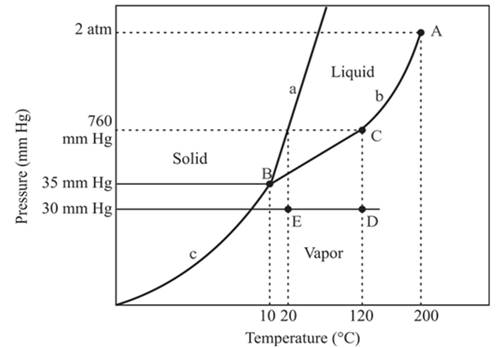
The triple point is defined as the equilibrium condition among all the three phases of any pure substance which is solid, liquid and gas. The curves are used for the equilibrium condition between two phases of pure substance. The phase diagram is shown below-
In the below diagram −
a = solid-liquid phase in equilibrium
b = liquid-vapor phase in equilibrium
c = solid-vapor phase in equilibrium
Given values-
Pressure = 35mmHg
Temperature = -50°C
These two given values are represented in the plot of the phase diagram of compound X. These two quantities are existing at the left of point B.
Hence,
At pressure 35 mmHg and at temperature -50°C, the physical state of the compound is solid.
(b)
Interpretation:
The normal boiling point of a compound is to be determined.
Concept introduction:
Phase diagram can be defined as the representation of pressure and temperature quantities of any pure substance. At these values of temperature and pressure, the different phases of the pure substance are equilibrium to each other.
Answer to Problem 17QAP
The normal boiling point of a compound is 120°C.
Explanation of Solution
The triple point is defined as the equilibrium condition among all the three phases of any pure substance which is solid, liquid and gas. The curves are used for the equilibrium condition between two phases of pure substance. The phase diagram is shown below-
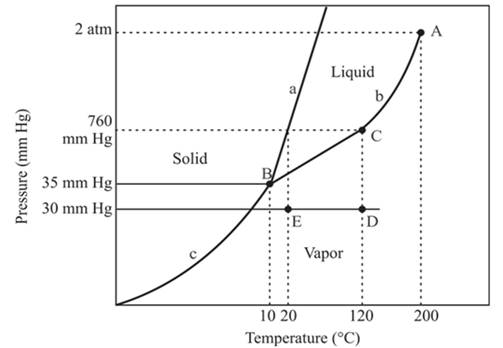
In the above diagram −
a = solid-liquid phase in equilibrium
b = liquid-vapor phase in equilibrium
c = solid-vapor phase in equilibrium
The normal boiling temperature is the temperature at which compound start boiling which is basically atmospheric pressure. Therefore pressure for the boiling point is 760mmHg. At atmospheric pressure of boiling point, if at the particular temperature the liquid and vapor phase of a substance are at equilibrium, then that temperature is the boiling point temperature. From the phase diagram of substance at temperature, 120°C liquid and vapor phase of a substance is at the equilibrium.
Hence, the boiling point temperature is 120°C.
(c)
Interpretation:
The critical point for the compound is to be located.
Concept introduction:
Phase diagram can be defined as the representation of pressure and temperature quantities of any pure substance. At these values of temperature and pressure, the different phases of the pure substance are equilibrium to each other.
Answer to Problem 17QAP
The critical point for the compound is located at point A.
Explanation of Solution
The triple point is defined as the equilibrium condition among all the three phases of any pure substance which is solid, liquid and gas. The curves are used for the equilibrium condition between two phases of water. The phase diagram is shown below-
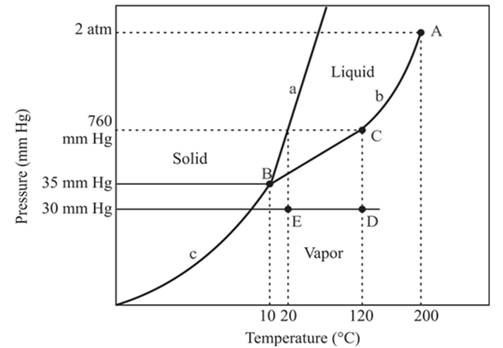
In the above diagram −
a = solid-liquid phase in equilibrium
b = liquid-vapor phase in equilibrium
c = solid-vapor phase in equilibrium
From the above diagram, the critical point of a substance is represented by the end of that curve which shows the equilibrium condition between the liquid phase and vapor phase. This curve is curved b and it ends at point A at temperature 200°C and at pressure 2 atm.
Hence, the critical point will exist at point A.
(d)
Interpretation:
The triple point for the compound is to be located.
Concept introduction:
Phase diagram can be defined as the representation of pressure and temperature quantities of any pure substance. At these values of temperature and pressure, the different phases of the pure substance are equilibrium to each other.
Answer to Problem 17QAP
The triple point for the compound is located at point B
Explanation of Solution
The triple point is defined as the equilibrium condition among all the three phases of any pure substance which is solid, liquid and gas. The curves are used for the equilibrium condition between two phases of water. The phase diagram is shown below-
In the above diagram −
a = solid-liquid phase in equilibrium
b = liquid-vapor phase in equilibrium
c = solid-vapor phase in equilibrium
The triple point represents the equilibrium among all the phases which are solid, liquid and gas of compound. Hence, the intersection point of all curves a, b and c will represent the triple point. From the graph, the intersection point of these three curves is existing at point B.
Therefore, point B will represent the triple point of the compound.
(e)
Interpretation:
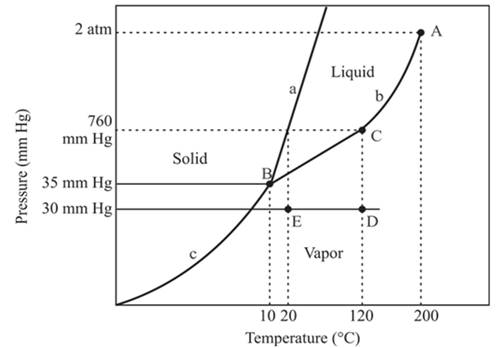
The changes are to be determined at constant pressure 30mmHg and the temperature is changing from 120°C to 20°C.
Concept introduction:
Phase diagram can be defined as the representation of pressure and temperature quantities of any pure substance. At these values of temperature and pressure, the different phases of the pure substance are equilibrium to each other.
Answer to Problem 17QAP
At constant pressure, 30mmHg and the process of changing of temperature from 120°C to 20°C is occurring between point D and E. In this process-
No change in phase.
The density of the vapor phase is high at point E in comparison to point D.
Explanation of Solution
The triple point is defined as the equilibrium condition among all the three phases of any pure substance which is solid, liquid and gas. The curves are used for the equilibrium condition between two phases of water. The phase diagram is shown below-
In the above diagram −
a = solid-liquid phase in equilibrium
b = liquid-vapor phase in equilibrium
c = solid-vapor phase in equilibrium
In this process the, the pressure is constant and the temperature varies from 120°C to 20°C which is represented by point D and E. the starting point D and end point E both are existing in the vapor phase. It means there is no phase change when the temperature is decreasing form 120°C to 20°C. The density of the vapor phase at point E will be increased because it is nearer to the liquid and the solid phase in comparison to point D.
(f)
Interpretation:
The densest phase is to be determined.
Concept introduction:
Phase diagram can be defined as the representation of pressure and temperature quantities of any pure substance. At these values of temperature and pressure, the different phases of the pure substance are equilibrium to each other.
Answer to Problem 17QAP
The densest phase is a solid phase.
Explanation of Solution
The triple point is defined as the equilibrium condition among all the three phases of any pure substance which is solid, liquid and gas. The curves are used for the equilibrium condition between two phases of water. The phase diagram is shown below-
In the above diagram −
a = solid-liquid phase in equilibrium
b = liquid-vapor phase in equilibrium
c = solid-vapor phase in equilibrium
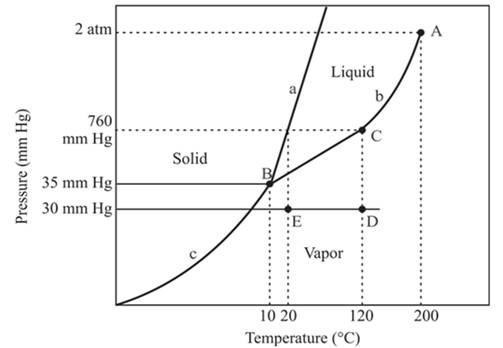
The densest part of this phase diagram is a solid phase because in solid phase all molecules are closely bound and from the diagram, we can see that the solid phase exists at the high temperature and low pressure, therefore, solid phase is the densest phase among all.
Want to see more full solutions like this?
Chapter 9 Solutions
OWLV2 FOR MASTERTON/HURLEY'S CHEMISTRY:
- 3. Name this compound properly, including stereochemistry. H₂C H3C CH3 OH 4. Show the step(s) necessary to transform the compound on the left into the acid on the right. Bri CH2 5. Write in the product of this LiAlH4 Br H₂C OHarrow_forwardWhat are the major products of the following reaction? Please provide a detailed explanation and a drawing to show how the reaction proceeds.arrow_forwardWhat are the major products of the following enolate alkylation reaction? Please include a detailed explanation as well as a drawing as to how the reaction proceeds.arrow_forward
- A block of zinc has an initial temperature of 94.2 degrees celcius and is immererd in 105 g of water at 21.90 degrees celcius. At thermal equilibrium, the final temperature is 25.20 degrees celcius. What is the mass of the zinc block? Cs(Zn) = 0.390 J/gxdegrees celcius Cs(H2O) = 4.18 J/gx degrees celcusarrow_forwardPotential Energy (kJ) 1. Consider these three reactions as the elementary steps in the mechanism for a chemical reaction. AH = -950 kJ AH = 575 kJ (i) Cl₂ (g) + Pt (s) 2C1 (g) + Pt (s) Ea = 1550 kJ (ii) Cl (g)+ CO (g) + Pt (s) → CICO (g) + Pt (s) (iii) Cl (g) + CICO (g) → Cl₂CO (g) Ea = 2240 kJ Ea = 2350 kJ AH = -825 kJ 2600 2400 2200 2000 1800 1600 1400 1200 1000 a. Draw the potential energy diagram for the reaction. Label the data points for clarity. The potential energy of the reactants is 600 kJ 800 600 400 200 0 -200- -400 -600- -800- Reaction Progressarrow_forwardCan u help me figure out the reaction mechanisms for these, idk where to even startarrow_forward
- Hi, I need your help with the drawing, please. I have attached the question along with my lab instructions. Please use the reaction from the lab only, as we are not allowed to use outside sources. Thank you!arrow_forwardHi, I need your help i dont know which one to draw please. I’ve attached the question along with my lab instructions. Please use the reaction from the lab only, as we are not allowed to use outside sources. Thank you!arrow_forward5. Write the formation reaction of the following complex compounds from the following reactants: 6. AgNO₃ + K₂CrO₂ + NH₄OH → 7. HgNO₃ + excess KI → 8. Al(NO₃)₃ + excess NaOH →arrow_forward
- Indicate whether the product formed in the reaction exhibits tautomerism. If so, draw the structure of the tautomers. CO₂C2H5 + CH3-NH-NH,arrow_forwardDraw the major product of this reaction N-(cyclohex-1-en-1-yl)-1-(pyrrolidino) reacts with CH2=CHCHO, heat, H3O+arrow_forwardDraw the starting material that would be needed to make this product through an intramolecular Dieckmann reactionarrow_forward
 Chemistry: Principles and ReactionsChemistryISBN:9781305079373Author:William L. Masterton, Cecile N. HurleyPublisher:Cengage Learning
 Principles of Modern ChemistryChemistryISBN:9781305079113Author:David W. Oxtoby, H. Pat Gillis, Laurie J. ButlerPublisher:Cengage Learning
 World of Chemistry, 3rd editionChemistryISBN:9781133109655Author:Steven S. Zumdahl, Susan L. Zumdahl, Donald J. DeCostePublisher:Brooks / Cole / Cengage Learning
 Chemistry: The Molecular ScienceChemistryISBN:9781285199047Author:John W. Moore, Conrad L. StanitskiPublisher:Cengage Learning
 Chemistry: Principles and PracticeChemistryISBN:9780534420123Author:Daniel L. Reger, Scott R. Goode, David W. Ball, Edward MercerPublisher:Cengage Learning
 General Chemistry - Standalone book (MindTap Cour...ChemistryISBN:9781305580343Author:Steven D. Gammon, Ebbing, Darrell Ebbing, Steven D., Darrell; Gammon, Darrell Ebbing; Steven D. Gammon, Darrell D.; Gammon, Ebbing; Steven D. Gammon; DarrellPublisher:Cengage Learning


