
Find the maximum positive shear and bending moment at point B.
Answer to Problem 13P
The maximum positive shear at point B is
The maximum positive bending moment at point B is
Explanation of Solution
Calculation:
Apply a 1 kN unit moving load at a distance of x from left end A.
Sketch the free body diagram of beam as shown in Figure 1.
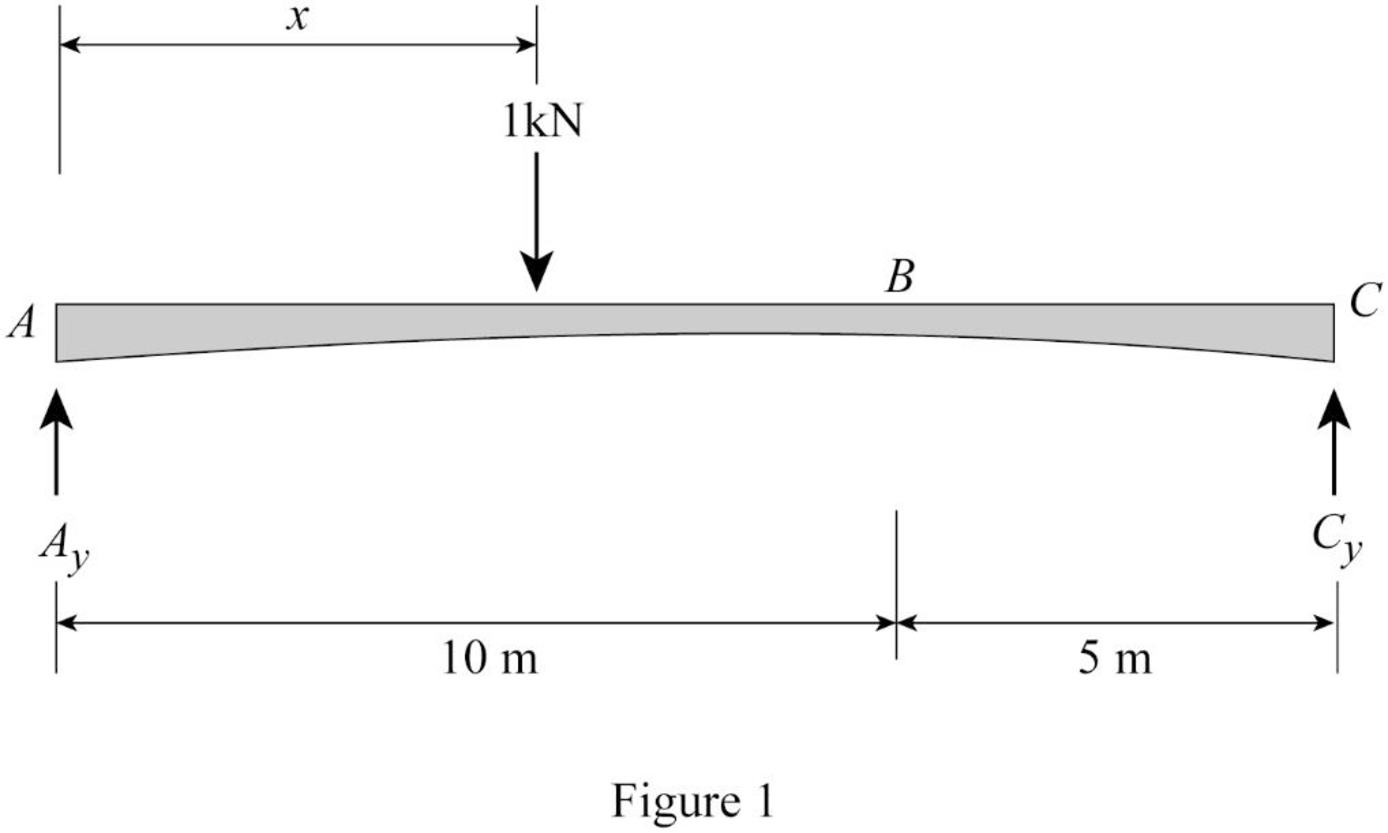
Refer Figure 1.
Find the equation of support reaction
Take moment about point C.
Consider moment equilibrium at point C.
Consider clockwise moment as positive and anticlockwise moment as negative.
Sum of moment at point C is zero.
Find the equation of support reaction
Apply vertical equilibrium equation of forces.
Consider upward force as positive
Substitute
Influence line for shear at point B.
Find the equation of shear force at B of portion AB
Sketch the free body diagram of the section AB as shown in Figure 2.
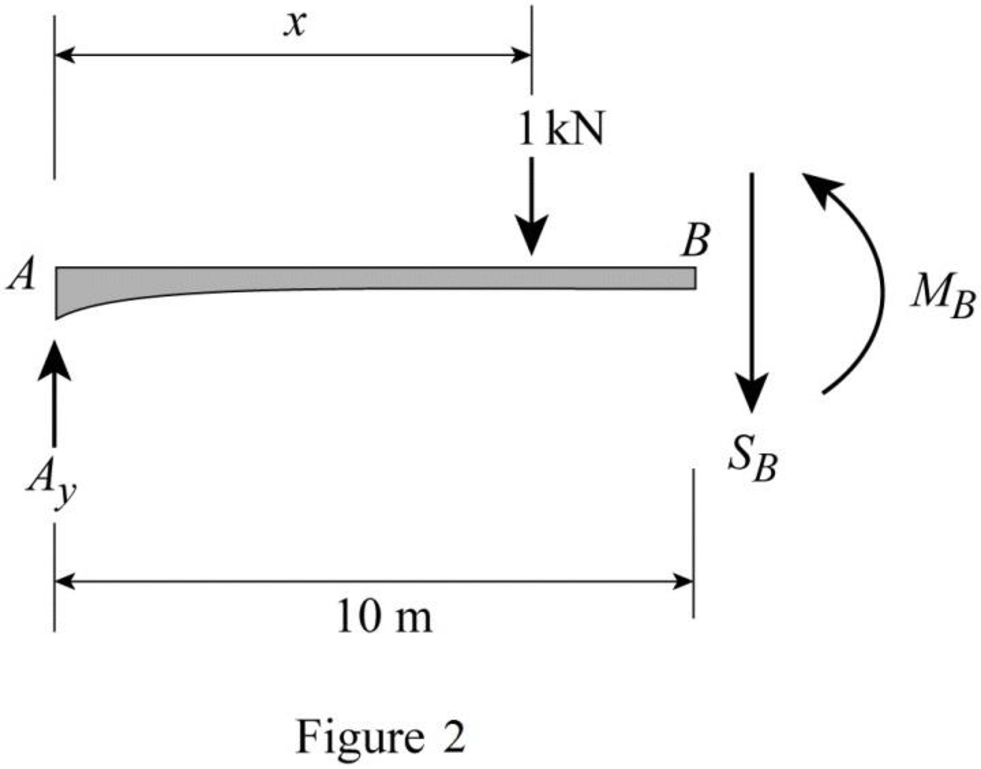
Refer Figure 2.
Apply equilibrium equation of forces.
Consider upward force as positive
Substitute
Find the equation of shear force at B of portion BC
Sketch the free body diagram of the section BC as shown in Figure 3.
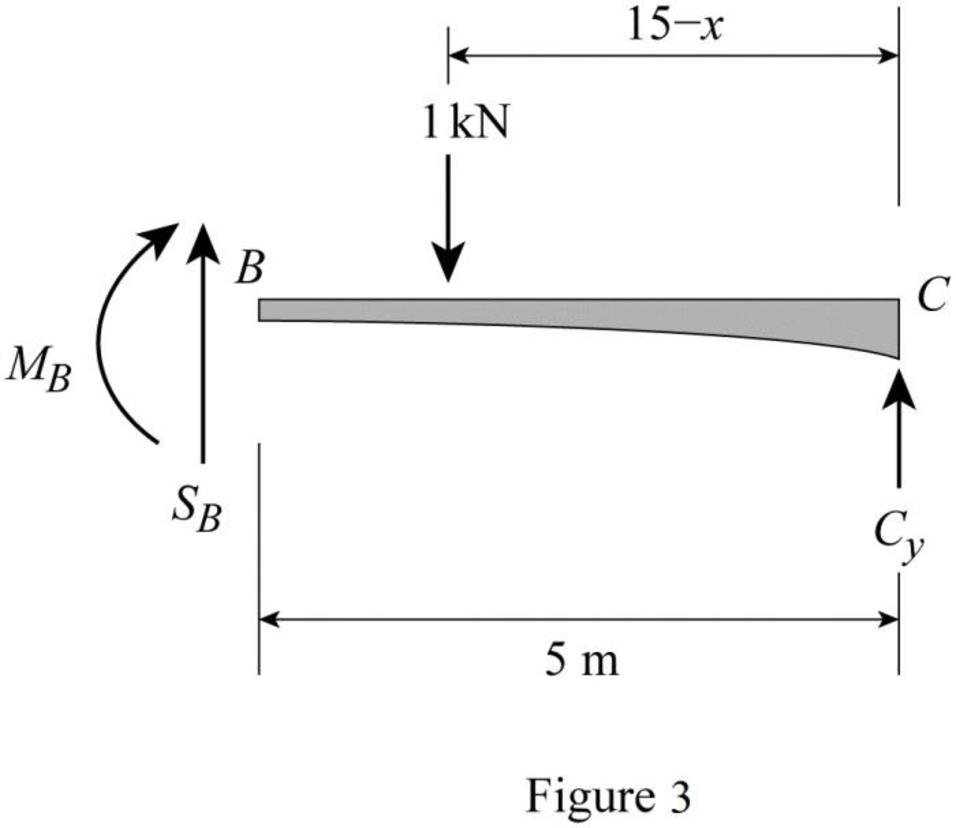
Refer Figure 3.
Apply equilibrium equation of forces.
Consider upward force as positive
Substitute
Thus, the equations of the influence line for
Find the value of influence line ordinate of shear force at various points of x using the Equations (3) and (4) and summarize the value as in Table 1.
| x | |
| 0 | 0 |
| 16 | 0 |
Draw the influence lines for the shear force at point B using Table 1 as shown in Figure 4.
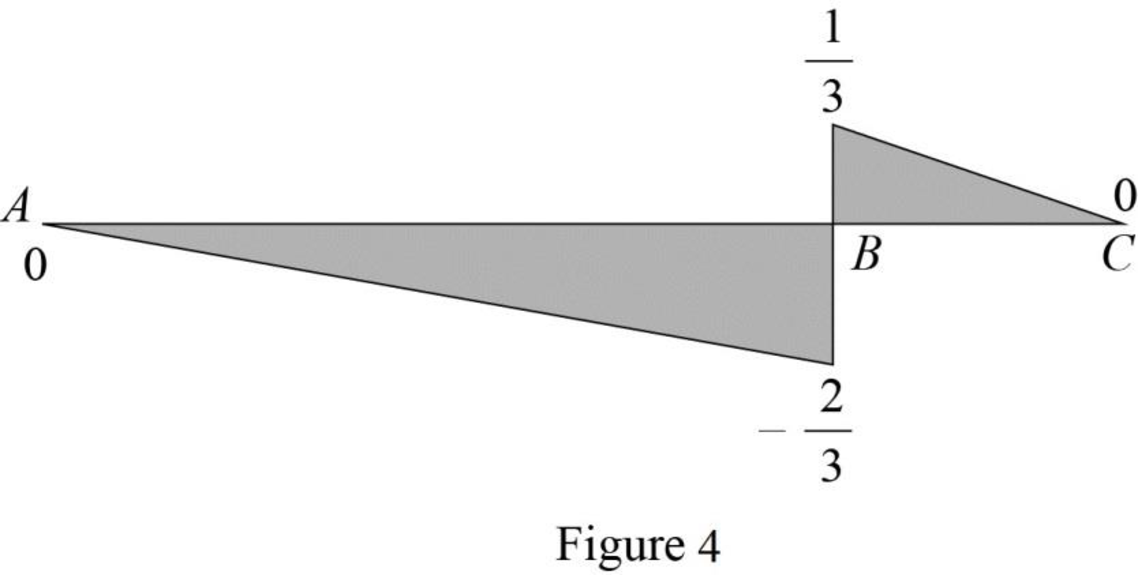
Refer Figure 4.
Find the slope
Here,
Substitute 10 m for
Find the slope
Here,
Substitute 5 m for
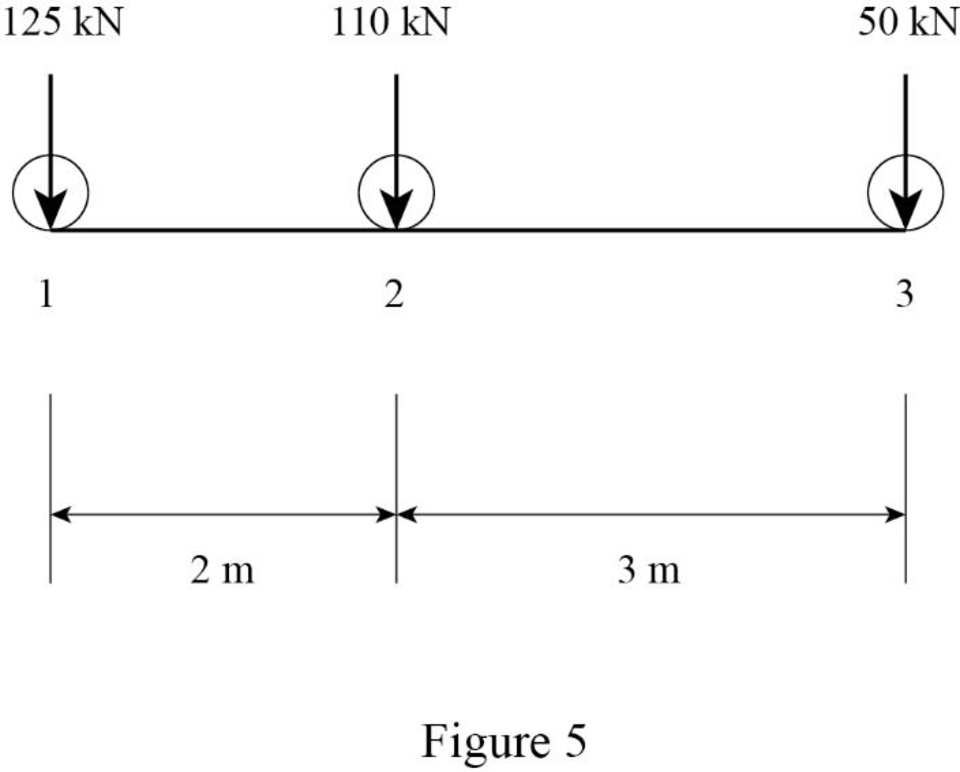
Sketch the loading position as shown in Figure 5.
Find the maximum positive shear force at B.
Sketch the loading position on the beam when the load 1 placed at just right of B as shown in Figure 6.
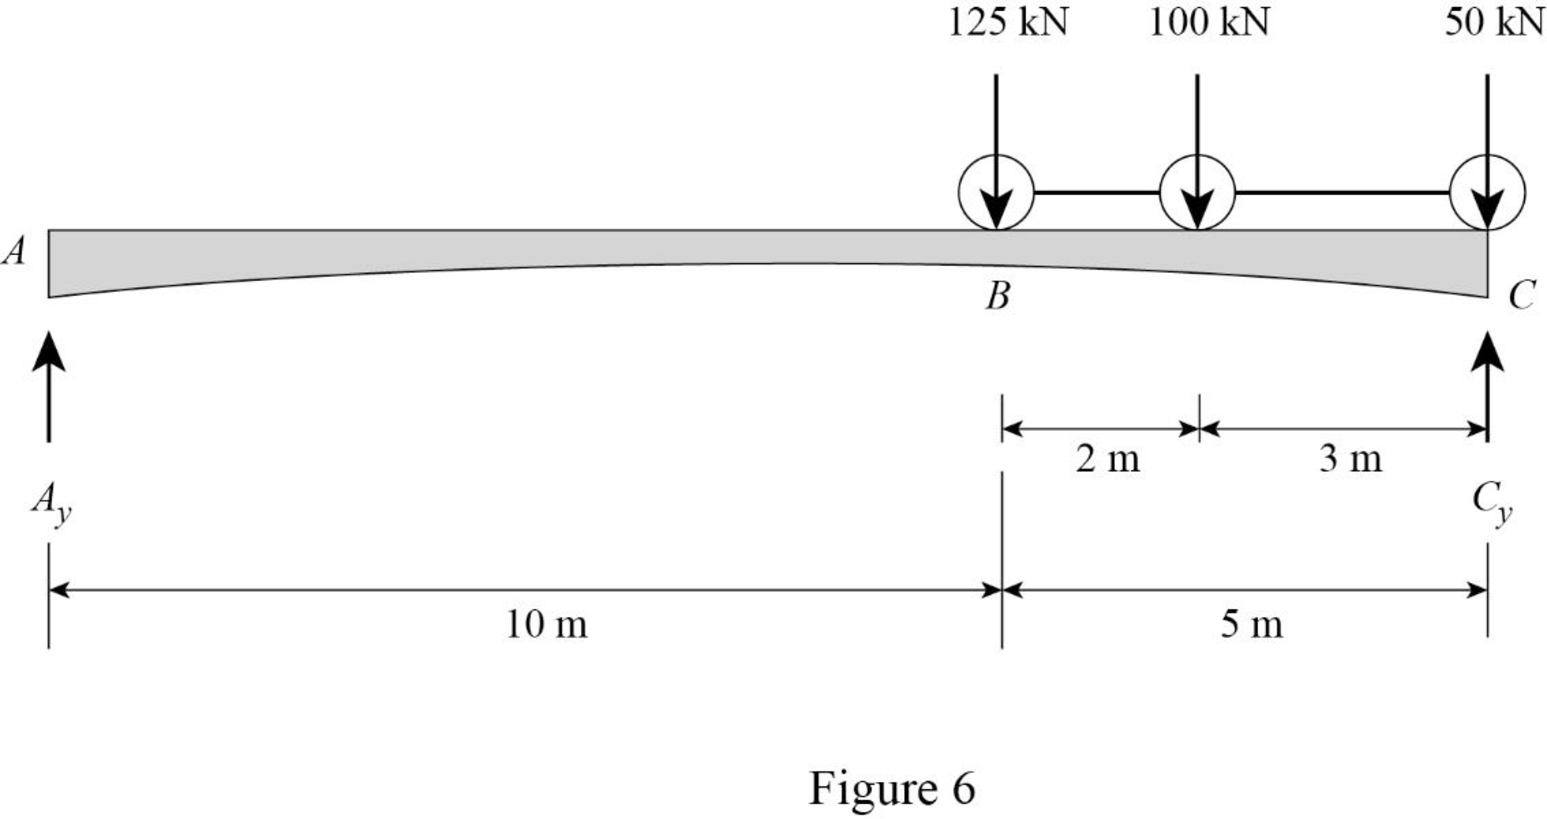
Refer Figure 6.
Find the shear force at B when the load 1 placed at just right of B.
Substitute 5 m for
Sketch the loading position on the beam when the load 2 placed at just right of B as shown in Figure 7.
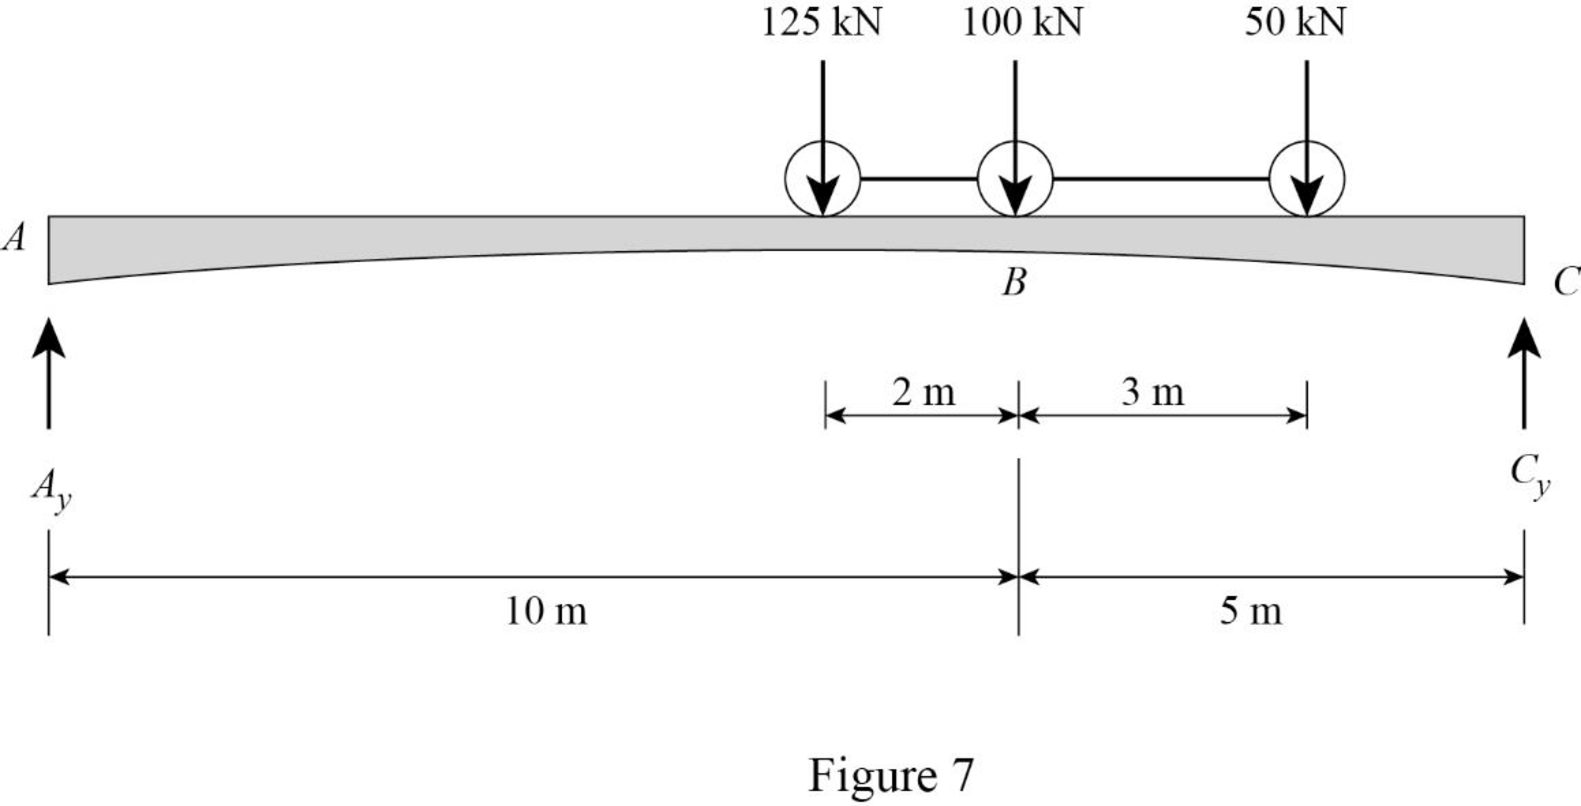
Refer Figure 7.
Find the shear force at B when the load 2 placed at just right of B.
Substitute 10 m for
Sketch the loading position on the beam when the load 3 placed at just right of B as shown in Figure 8.
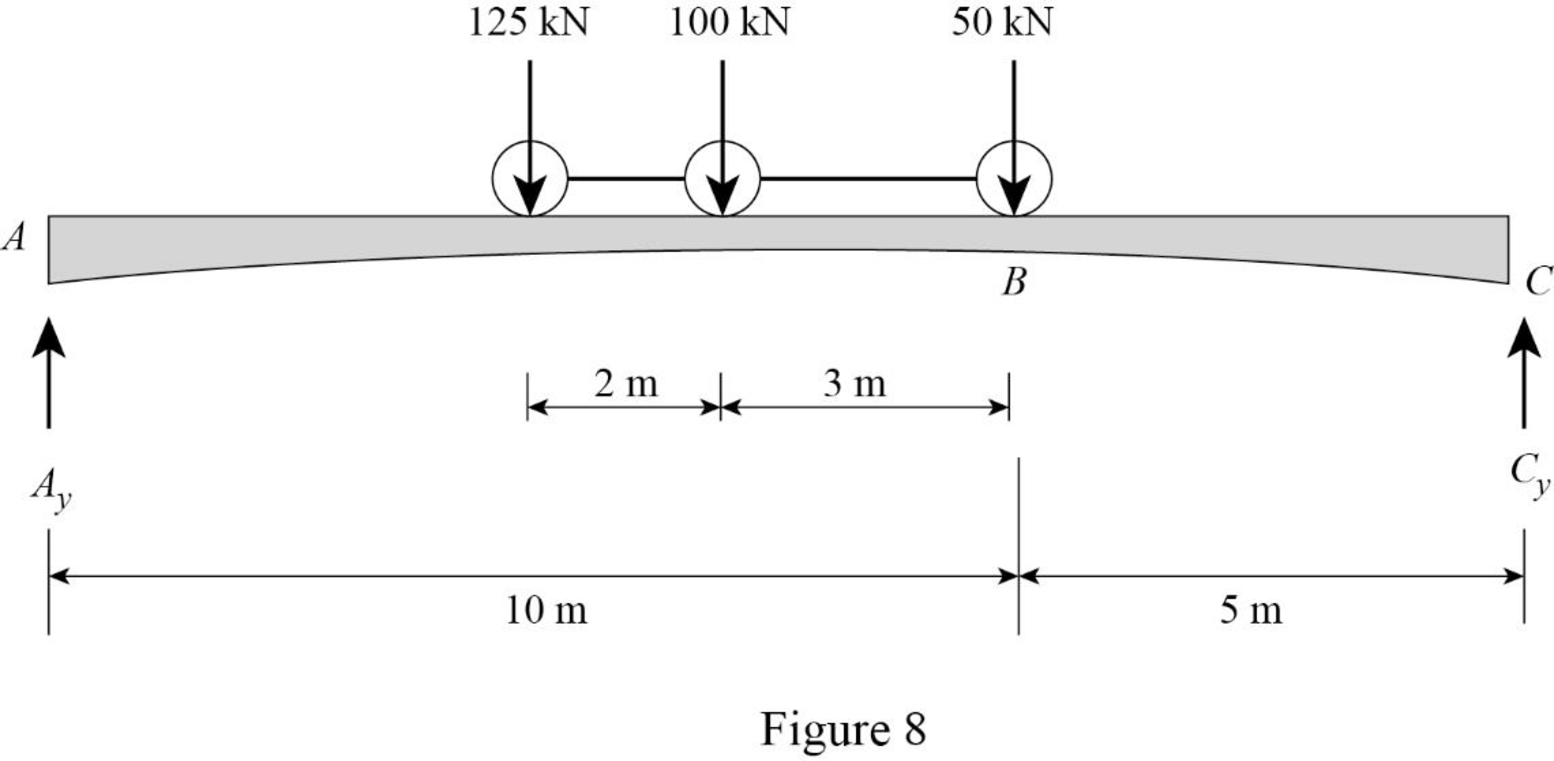
Refer Figure 8.
Find the shear force at B when the load 3 placed at just right of B.
Substitute 10 m for
Maximum positive shear force at B as follows.
The maximum positive shear at B is the maximum of
Therefore, the maximum positive shear at point B is
Influence line for moment at B.
Refer Figure 2.
Consider clockwise moment as positive and anticlockwise moment as negative.
Find the equation of moment at B of portion AB
Substitute
Refer Figure 3.
Consider clockwise moment as negative and anticlockwise moment as positive.
Find the equation of moment at B of portion BC
Substitute
Thus, the equations of the influence line for
Find the value of influence line ordinate of moment at various points of x using the Equations (5) and (6) and summarize the value as in Table 2.
| x | |
| 0 | 0 |
| 10 | |
| 15 | 0 |
Draw the influence lines for the moment at point B using Table 2 as shown in Figure 9.
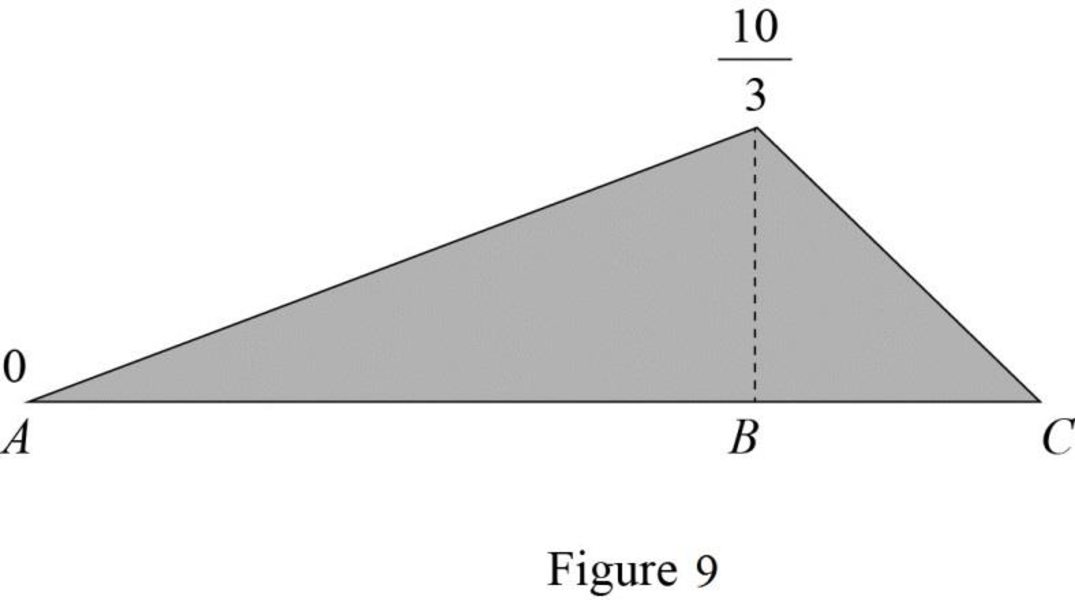
Refer Figure 9.
Find the slope
Here,
Substitute 10 m for
Find the slope
Here,
Substitute 5 m for
Find the maximum positive bending moment at B.
Refer Figure 6.
Find the bending moment at B when the load 1 placed at just right of B.
Substitute 5 m for
Refer Figure 7.
Find the bending moment at B when the load 2 placed at just right of B.
Substitute 10 m for
Refer Figure 8.
Find the bending moment at B when the load 3 placed at just right of B.
Substitute 10 m for
Maximum positive bending moment at B. as follows.
The maximum positive bending moment at B is the maximum of
Therefore, the maximum positive bending moment at point B is
Want to see more full solutions like this?
Chapter 9 Solutions
Structural Analysis, SI Edition

- For question 2 do 2% please. Use El centro spectrum to answer the secon question please. Thank you for your help!arrow_forwardsolve pleasearrow_forwardA mechanism for pushing small boxes from an assembly line onto a conveyor belt is shown with arm OD and crank CB in their vertical positions. For the configuration shown, crank CB has a constant clockwise angular velocity of 0.6π rad/s. Determine the acceleration QE of E (positive if to the right, negative if down). 450 mm 215 mm 565 mm A 185 mm 105 mm 110185. mm mm Answer: a = i B 40 mm E m/s²arrow_forward
- Please answer the following questions in the picture, use the second picture to answer some of the questions. I appreciate your help! Explain step by step, thank you!arrow_forwardQuestion 5. Three pipes A, B, and C are interconnected as in Fig. 2. The pipe characteristics are given below. Find the rate at which water will flow in each pipe. Find also the pressure at point P. (Neglect minor losses) Pipe D (in) L (ft) f A 6 2000 0.020 B 4 1600 0.032 C 8 3000 0.02 -El. 200 ft P -El. 120 ft B Fig. 2 -El. 50 ft.arrow_forwardcalculate all nodal displacementts and all the member forces of the trussarrow_forward
- NOTE: Use areal methods only for V,M,N diagrams(Do NOT use the equations) (also draw the N diagram(s) for the entire structure)arrow_forwardThe figure below shows a foundation of 10 ft x 6.25 ft resting on a sand deposit. The net load per unit area at the level of the foundation, qo, is 2100 lb/ft². For the sand, μs = 0.3, E, = 3200 lb/in.², Dƒ = 2.5 ft, and H = 32 ft. Foundation BX L Rigid foundation settlement Flexible foundation settlement H μ, Poisson's ratio E, = Modulus of elasticity Soil Rock Elastic settlement of flexible and rigid foundations Table 1 Variation of F₁ with m' and n' m' n' 1.0 1.2 1.4 1.6 1.8 2.0 2.5 3.0 0.25 0.014 0.013 0.012 0.011 0.011 0.011 0.010 0.010 0.50 0.049 0.046 0.044 0.042 0.041 0.040 0.038 0.038 1.00 0.142 0.138 0.134 0.130 0.127 0.125 0.121 0.118 2.00 0.285 0.290 0.292 0.292 0.291 0.289 0.284 0.279 5.00 0.437 0.465 0.487 0.503 0.516 0.526 0.543 0.551 10.00 0.498 0.537 0.570 0.597 0.621 0.641 0.679 0.707 20.00 0.529 0.575 0.614 0.647 0.677 0.702 0.756 0.797 50.00 0.548 0.598 0.640 0.678 0.711 0.740 0.803 0.853 100.00 0.555 0.605 0.649 0.688 0.722 0.753 0.819 0.872 Table 2 Variation of F2…arrow_forward= == An 8 m high retaining wall supports a 5.5 m deep sand (Ya 18.5 kN/m³, q = 34°) overlying a saturated sandy clay (y_sat = 20.3 kN/m³, q = 28°, c = 17 kPa). The groundwater level is located at the interface of two layers. Sketch the lateral stress distribution up to a depth of 8 m for an active condition. Also, determine the line of action of the resultant. 5.5 m Sand |Y=18.5 kN/m³ |₁ =34° Sandy : clay 2.5 m |c=17 kPa Ysat 20.3 kN/m³ 2=28°arrow_forward
- 3. What is the maximum allowable load that can be applied to the pile shown below? : Qall = ? G.W.T. 45' Soft Clay: Ysat 100 pcf Cu = 500 psf, ou = 0° Clay Shale: Qu(lab) 24,000 psi o' = 15° Driven Steel H-Pile: 1/2" thick steel web & flanges (soil plugged) -10". I Note: Pile & soil profile are not drawn to scale Please use the approach outlined in Das 12.16 and an Allowable Stress Design (ASD) approach for your analysis. Use a factor of safety = 3 for design, neglect any effect that shaft resistance has on pile capacity, and neglect the effect of the weight of the pile in your analysis.arrow_forward2. Calculate the ultimate load carrying capacity of the pile tip driven into the soil profile shown below: G.W.T. Qapp 40' Soft Clay: Ysat 100 pcf Cu 500 psf, ₁ = 0° 4c+4 Poorly Graded Sand (SP): Ysat = 125 pcf Q₁ = ? c' = 0, ' = 35° Driven Steel Pipe Pile: Outside Diameter = 2' Inside Diameter = 1'11" Hollow (soil plugged) Note: Pile & soil profile are not drawn to scale For this problem, please calculate N₁* using both the bearing capacity theory approach and using standard design charts. Compare the values that result from these two approaches. Please use only the Nq* from bearing capacity theory for the remainder of your calculations.arrow_forwardDesign a fully restrained BFP moment connection to support the factored bending moment of 1,200 kN·m and factored shear force of 95 kN due to wind and gravity loads. Use 90mm spacing between the bolts, and 40mm edge spacing. The steel grade is A992 for the W920 × 201 beam and W840 × 359 column and A36 for the steel plate (30 mm thick). Use FEXX = 450 MPa electrodes and 20mm A490 bolts (threads included) for the flange plate (Fr= 457 MPa), 16mm A307 bolts for the shear tab (Fnv = 165 MPa). Steel Section Properties W920 × 201 W840 × 359 D₁ = 904 mm bf = 305 mm tf = 20.1 mm tw = 15.2 mm d = 869 mm bf = 404 mm tf = 35.6 mm tw = 21.1 mm Summary of answer: Flange Plate: bPL = tPL = No. of Bolts: Flange bolt = Thickness of fillet weld on shear tab:. Shear tab =arrow_forward
