The Sawtooth Curve An oscilloscope often displays a sawtooth curve . This curve can be approximated by sinusoidal curves of varying periods and amplitudes. (a) Use a graphing utility to graph the following function, which can be used to approximate the sawtooth curve.(a) Use a graphing utility to graph the following function, which can be used to approximate the sawtooth curve. f ( x ) = 1 2 sin ( 2 π x ) + 1 4 sin ( 4 π x ) 0 ≤ x ≤ 4 (b) A better approximation to the sawtooth curve is given by f ( x ) = 1 2 sin ( 2 π x ) + 1 4 sin ( 4 π x ) + 1 8 sin ( 8 π x ) Use a graphing utility to graph this function for 0 ≤ x ≤ 4 and compare the result to the graph obtained in part (a). (c) A third and even better approximation to the sawtooth curve is given by f ( x ) = 1 2 sin ( 2 π x ) + 1 4 sin ( 4 π x ) + 1 8 sin ( 8 π x ) + 1 16 sin ( 16 π x ) Use a graphing utility to graph this function for 0 ≤ x ≤ 4 and compare the result t
The Sawtooth Curve An oscilloscope often displays a sawtooth curve . This curve can be approximated by sinusoidal curves of varying periods and amplitudes. (a) Use a graphing utility to graph the following function, which can be used to approximate the sawtooth curve.(a) Use a graphing utility to graph the following function, which can be used to approximate the sawtooth curve. f ( x ) = 1 2 sin ( 2 π x ) + 1 4 sin ( 4 π x ) 0 ≤ x ≤ 4 (b) A better approximation to the sawtooth curve is given by f ( x ) = 1 2 sin ( 2 π x ) + 1 4 sin ( 4 π x ) + 1 8 sin ( 8 π x ) Use a graphing utility to graph this function for 0 ≤ x ≤ 4 and compare the result to the graph obtained in part (a). (c) A third and even better approximation to the sawtooth curve is given by f ( x ) = 1 2 sin ( 2 π x ) + 1 4 sin ( 4 π x ) + 1 8 sin ( 8 π x ) + 1 16 sin ( 16 π x ) Use a graphing utility to graph this function for 0 ≤ x ≤ 4 and compare the result t
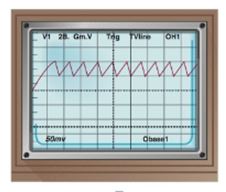
Solution Summary: The author explains how a sawtooth curve can be approximated by sinusoidal curves of varying periods and amplitudes.
The Sawtooth Curve
An oscilloscope often displays a sawtooth curve. This curve can be approximated by sinusoidal curves of varying periods and amplitudes.
(a) Use a graphing utility to graph the following function, which can be used to approximate the sawtooth curve.(a) Use a graphing utility to graph the following function, which can be used to approximate the sawtooth curve.
(b) A better approximation to the sawtooth curve is given by
Use a graphing utility to graph this function for
and compare the result to the graph obtained in part (a).
(c) A third and even better approximation to the sawtooth curve is given by
Use a graphing utility to graph this function for
and compare the result t
a) let SSK : A->R be function and let
c be acluster Point of A if lim S, (x) exists
for each i=1, 2, .-,k then
K
i) lim Si (x)= lim fi (x)
X->C 1=1
11), im π fi (x) = lim fi (x)
YC il
i=1
1) let f(x) = ) x² Sin (1/x), xe Q/{o}
f(x) = {
x² cos(\/x), x&Q
Show that lim f(x)= 0
X = 0
c) Give an example of aset ASR, a cluster Point C
of Aand two fun. & 9: AR st lim f(x)9(x) exsis
bat limfex) does not exist
X-C
2. [-/4 Points]
DETAILS
MY NOTES
SESSCALCET2 7.3.002.
Let S be the solid obtained by rotating the region shown in the figure about the y-axis. (Assume a = 6 and b = 2.)
ASK YOUR TEACHER
0
y = a sin(bx²)
Sketch a typical approximating shell.
y
6
4
2
x
π/b
y
2
1
x
0.5
1.0
1.5
0.2
0.4
0.6
0.8
1.0
-2
-1
-4
The graph of f', the derivative of f, is shown in the graph below. If f(-9) = -5, what is the value of f(-1)?
y
87 19
6
LO
5
4
3
1
Graph of f'
x
-10 -9 -8 -7 -6 -5 -4 -3 -2 -1
1
2
3
4 5
6
7 8 9 10
-1
-2
-3
-4
-5
-6
-7
-8
564%
Chapter 8 Solutions
Precalculus Enhanced with Graphing Utilities Plus MyLab Math with Pearson eText - Access Card Package (7th Edition) (Sullivan & Sullivan Precalculus Titles)
Need a deep-dive on the concept behind this application? Look no further. Learn more about this topic, calculus and related others by exploring similar questions and additional content below.
Area Between The Curve Problem No 1 - Applications Of Definite Integration - Diploma Maths II; Author: Ekeeda;https://www.youtube.com/watch?v=q3ZU0GnGaxA;License: Standard YouTube License, CC-BY


 Algebra & Trigonometry with Analytic GeometryAlgebraISBN:9781133382119Author:SwokowskiPublisher:Cengage
 Trigonometry (MindTap Course List)TrigonometryISBN:9781305652224Author:Charles P. McKeague, Mark D. TurnerPublisher:Cengage Learning
 Algebra and Trigonometry (MindTap Course List)AlgebraISBN:9781305071742Author:James Stewart, Lothar Redlin, Saleem WatsonPublisher:Cengage Learning
 Trigonometry (MindTap Course List)TrigonometryISBN:9781337278461Author:Ron LarsonPublisher:Cengage Learning