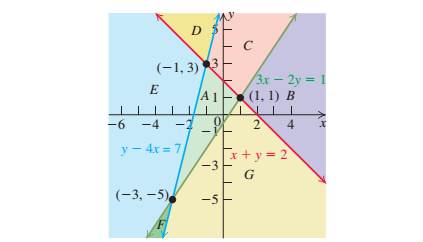
In Exercises 47-52, use the following figure to indicate the regions (A-G) that correspond to the graph of the given stem of inequalities.

47.
Want to see the full answer?
Check out a sample textbook solution
Chapter 8 Solutions
Pearson eText for College Algebra and Trigonometry -- Instant Access (Pearson+)
- 1. If f(x² + 1) = x + 5x² + 3, what is f(x² - 1)?arrow_forward2. What is the total length of the shortest path that goes from (0,4) to a point on the x-axis, then to a point on the line y = 6, then to (18.4)?arrow_forwardموضوع الدرس Prove that Determine the following groups Homz(QZ) Hom = (Q13,Z) Homz(Q), Hom/z/nZ, Qt for neN- (2) Every factor group of adivisible group is divisble. • If R is a Skew ficald (aring with identity and each non Zero element is invertible then every R-module is free.arrow_forward
- Please help me with these questions. I am having a hard time understanding what to do. Thank youarrow_forwardAnswersarrow_forward************* ********************************* Q.1) Classify the following statements as a true or false statements: a. If M is a module, then every proper submodule of M is contained in a maximal submodule of M. b. The sum of a finite family of small submodules of a module M is small in M. c. Zz is directly indecomposable. d. An epimorphism a: M→ N is called solit iff Ker(a) is a direct summand in M. e. The Z-module has two composition series. Z 6Z f. Zz does not have a composition series. g. Any finitely generated module is a free module. h. If O→A MW→ 0 is short exact sequence then f is epimorphism. i. If f is a homomorphism then f-1 is also a homomorphism. Maximal C≤A if and only if is simple. Sup Q.4) Give an example and explain your claim in each case: Monomorphism not split. b) A finite free module. c) Semisimple module. d) A small submodule A of a module N and a homomorphism op: MN, but (A) is not small in M.arrow_forward
- I need diagram with solutionsarrow_forwardT. Determine the least common denominator and the domain for the 2x-3 10 problem: + x²+6x+8 x²+x-12 3 2x 2. Add: + Simplify and 5x+10 x²-2x-8 state the domain. 7 3. Add/Subtract: x+2 1 + x+6 2x+2 4 Simplify and state the domain. x+1 4 4. Subtract: - Simplify 3x-3 x²-3x+2 and state the domain. 1 15 3x-5 5. Add/Subtract: + 2 2x-14 x²-7x Simplify and state the domain.arrow_forwardQ.1) Classify the following statements as a true or false statements: Q a. A simple ring R is simple as a right R-module. b. Every ideal of ZZ is small ideal. very den to is lovaginz c. A nontrivial direct summand of a module cannot be large or small submodule. d. The sum of a finite family of small submodules of a module M is small in M. e. The direct product of a finite family of projective modules is projective f. The sum of a finite family of large submodules of a module M is large in M. g. Zz contains no minimal submodules. h. Qz has no minimal and no maximal submodules. i. Every divisible Z-module is injective. j. Every projective module is a free module. a homomorp cements Q.4) Give an example and explain your claim in each case: a) A module M which has a largest proper submodule, is directly indecomposable. b) A free subset of a module. c) A finite free module. d) A module contains no a direct summand. e) A short split exact sequence of modules.arrow_forward
 Holt Mcdougal Larson Pre-algebra: Student Edition...AlgebraISBN:9780547587776Author:HOLT MCDOUGALPublisher:HOLT MCDOUGAL
 Big Ideas Math A Bridge To Success Algebra 1: Stu...AlgebraISBN:9781680331141Author:HOUGHTON MIFFLIN HARCOURTPublisher:Houghton Mifflin Harcourt
 Elementary AlgebraAlgebraISBN:9780998625713Author:Lynn Marecek, MaryAnne Anthony-SmithPublisher:OpenStax - Rice University
 Glencoe Algebra 1, Student Edition, 9780079039897...AlgebraISBN:9780079039897Author:CarterPublisher:McGraw Hill
 Algebra: Structure And Method, Book 1AlgebraISBN:9780395977224Author:Richard G. Brown, Mary P. Dolciani, Robert H. Sorgenfrey, William L. ColePublisher:McDougal Littell


