
Using Table G, find the critical value(s) for each. Indicate the noncritical region or regions, and state the null and alternative hypotheses. Use σ2 = 225.
a. α = 0.10, n = 14, two-tailed
b. α = 0.05, n = 27, right-tailed
c. α = 0.01, n = 9, left-tailed
d. α = 0.05, n = 17, right-tailed
a.
To find: The critical values for two tailed test.
Answer to Problem 1E
The critical values for two tailed test is 5.892 and 23.362, respectively.
Null hypothesis:
Alternative hypothesis:
Explanation of Solution
Given info:
The level of significance is
Answer:
Degrees of freedom:
The area to the right of larger value is,
From “Table G: The chi square distribution”, the critical values for the
Critical and non critical region:
Software Procedure:
Step-by-step procedure to obtain the critical region and non critical using the MINITAB software:
- Choose Graph > Probability Distribution Plot > choose View Probability> OK.
- From Distribution, choose Chi-square.
- In Degrees of freedom, enter 13.
- Click the Shaded Area tab.
- Choose Probability value and Both Tail for the region of the curve to shade.
- Enter the Probability value as 0.10.
- Click OK.
Output using the MINITAB software is given below:
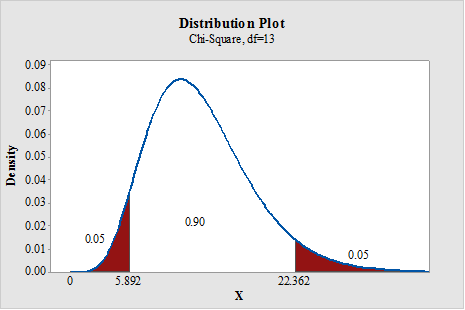
State the null and alternative hypotheses:
Here, the claim is that the population variance is 225. This can be written as
Null hypothesis:
Alternative hypothesis:
b.
To find: The critical value for right tailed test.
Answer to Problem 1E
The critical value for right tailed test is 38.885.
Null hypothesis:
Alternative hypothesis:
Explanation of Solution
Given info:
The level of significance is
Answer:
Degrees of freedom:
From “Table G: The chi square distribution”, the critical values for the
Critical and non critical region:
Software Procedure:
Step-by-step procedure to obtain the critical region and non critical using the MINITAB software:
- Choose Graph > Probability Distribution Plot > choose View Probability> OK.
- From Distribution, choose Chi-square.
- In Degrees of freedom, enter 26.
- Click the Shaded Area tab.
- Choose Probability value and Right Tail for the region of the curve to shade.
- Enter the Probability value as 0.05.
- Click OK.
Output using the MINITAB software is given below:
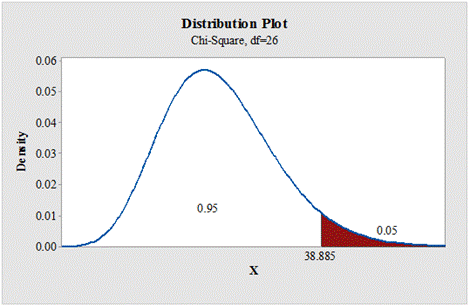
State the null and alternative hypotheses:
Null hypothesis:
Alternative hypothesis:
c.
To find: The critical value for left tailed test.
Answer to Problem 1E
The critical value for left tailed test is 1.646.
Null hypothesis:
Alternative hypothesis:
Explanation of Solution
Given info:
The level of significance is
Answer:
Degrees of freedom:
If the test is left tail, the level of significance is subtracted from 1. That is,
From “Table G: The chi square distribution”, the critical values for the
Critical and non critical region:
Software Procedure:
Step-by-step procedure to obtain the critical region and non critical using the MINITAB software:
- Choose Graph > Probability Distribution Plot > choose View Probability> OK.
- From Distribution, choose Chi-square.
- In Degrees of freedom, enter 8.
- Click the Shaded Area tab.
- Choose Probability value and Left Tail for the region of the curve to shade.
- Enter the Probability value as 0.01.
- Click OK.
Output using the MINITAB software is given below:
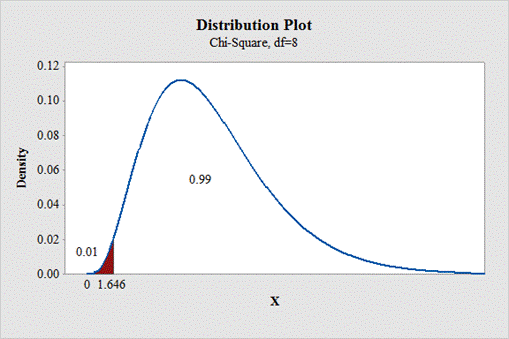
State the null and alternative hypotheses:
Null hypothesis:
Alternative hypothesis:
d.
To find: The critical value for right tailed test.
Answer to Problem 1E
The critical value for right tailed test is 26.296.
Null hypothesis:
Alternative hypothesis:
Explanation of Solution
Given info:
The level of significance is
Answer:
Degrees of freedom:
From “Table G: The chi square distribution”, the critical values for the
Critical and non critical region:
Software Procedure:
Step-by-step procedure to obtain the critical region and non critical using the MINITAB software:
- Choose Graph > Probability Distribution Plot > choose View Probability> OK.
- From Distribution, choose Chi-square.
- In Degrees of freedom, enter 16.
- Click the Shaded Area tab.
- Choose Probability value and Right Tail for the region of the curve to shade.
- Enter the Probability value as 0.05.
- Click OK.
Output using the MINITAB software is given below:
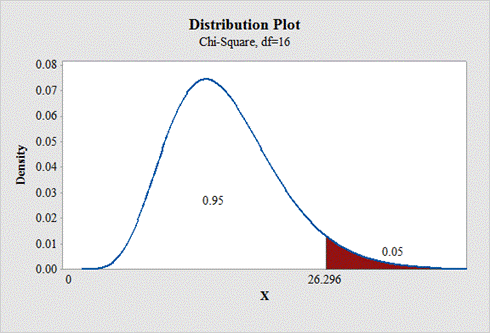
State the null and alternative hypotheses:
Null hypothesis:
Alternative hypothesis:
Want to see more full solutions like this?
Chapter 8 Solutions
Elementary Statistics: A Step By Step Approach
- Find the p-value to test ?0H0: ?=45σ=45 ?1H1: ?<45σ<45 and the test statistic is 13.125 with n=15.arrow_forwardFind the indicated critical value. Z0.03arrow_forwardDo a complete analysis by performing the following steps: State the hypotheses and identify the claim. Find the critical value. Use α = 0.05 Compute the test value. Make the decision. Summarize the results. The table shows the average maximum sentence length for a certain crime and the actual time serve in months. Is there a relationship between the two? Crime Sentence Time Served Murder 227 97 Rape 120 45 Robbery 106 40 Burglary 77 26 Drug Offenses 60 18 Weapons Offenses 49 21arrow_forward
- Match each Test Situation with the correct Critical Value. For a two-sided test, find only the positive value. Test Situation Critical Value v One sample, o is unknown, n = 32, H.:µ > Ho, and a = 0.10 a. 1.960 One sample, o is known, n = 100, Ha:u + po, and a = 0.06 b. 2.054 v One sample, o is unknown, n = 27, Ha: µ + lo, and a = 0.05 C. -3.090 v One sample, n = 150, Ha:p Hn, and a = 0.05 f. 2.056 g. 1.645 v One sample, n = 35, Ha:p + Po, and a = 0.05 h. 1.309 v One sample, n 15, Ha:p > Po, and a = 0.02 Submit Question O Type here to search op %23 24 & 3. Q E R tab s lock D G K C SIarrow_forwardArm circumferences (cm) and heights (cm) are measured from randomly selected adult females. The 148 pairs of measurements yield x= 32.00 cm, y = 162.25 cm, r= 0.044, P-value = 0.596, and y = 159 +0.1111x. Find the best predicted value of y (height) given an adult female with an arm circumference of 32.0 cm. Let the predictor variable x be arm circumference and the response variable y be height. Use a 0.05 significance level. The best predicted value is cm. (Round to two decimal places as needed.)arrow_forwardArm circumferences (cm) and heights (cm) are measured from randomly selected adult females. The 143 pairs of measurements yield x = 32.40 cm, y = 160.39 cm, r=0.072, P-value = 0.393, and y = 157 + 0.1075x. Find the best predicted value of y (height) given an adult female with an arm circumference of 34.0 cm. Let the predictor variable x be arm circumference and the response variable y be height. Use a 0.05 significance level. %3D The best predicted value is cm. (Round to two decimal places as needed.) Enter your answer in the answer box. MacBook Pro 888 esc %24 % & 4. 9- E T. Y. H. K %#3arrow_forward
- Q3- A- Find the critical (t) values for: 1- a= 0.01 with d.f. = 15 for a right-tailed t test. %3D 2- a= 0.01 with d.f. = 20 for a left-tailed t test. %3D 3- a= 0.01 with d.f.= 18 for two-tailed t test.arrow_forwardMatch each Test Situation with the correct Critical Value. For a two-sided test, find only the positive value. Test Situation Ha: P1 P2 + 0 and a = 0.001 Ha:Pi – P2 7 0 and a = 0.02 Ha:P1 – p2 0 and a = 0.005 Ha: P1 – P2 > 0 and a = 0.04 Critical Value a. 1.751 b. 2.326 с. 2.576 d. -1.960 е. 3.291arrow_forwardAn 37. Calculate coeff. of Q.D. and Bowley's coeff. of skewness from the data given below: Profits (Rs. lakh) No. of Cos. Less than 10 20 20 30 40 40 50 50 56 60 59 (MBA., HFU., 2011) 70 60arrow_forward
- answer the 2 questionarrow_forwardA manufacturer wants to increase the shelf life of a line of cake mixes. Past records indicate that the average shelf life of the mix is 231 days. After a revised mix has been developed, a sample of nine boxes of cake mix gave these shelf lives (in days): 230,233, 235, 236, 233, 240, 240, 241, and 237. Using α = 0.025, has the shelf life of the cake mix increased? Multiple Choice Yes, because computed t is greater than the critical value. Yes, because computed t is less than the critical value. No, because computed t lies in the region of acceptance. No, because 236.11 is quite close to 231.arrow_forwardFind the value of “z sub alpha” z0.15 And for z0.02arrow_forward
- Algebra & Trigonometry with Analytic GeometryAlgebraISBN:9781133382119Author:SwokowskiPublisher:Cengage
 Glencoe Algebra 1, Student Edition, 9780079039897...AlgebraISBN:9780079039897Author:CarterPublisher:McGraw Hill

