
Videos
Critical Thinking Challenges
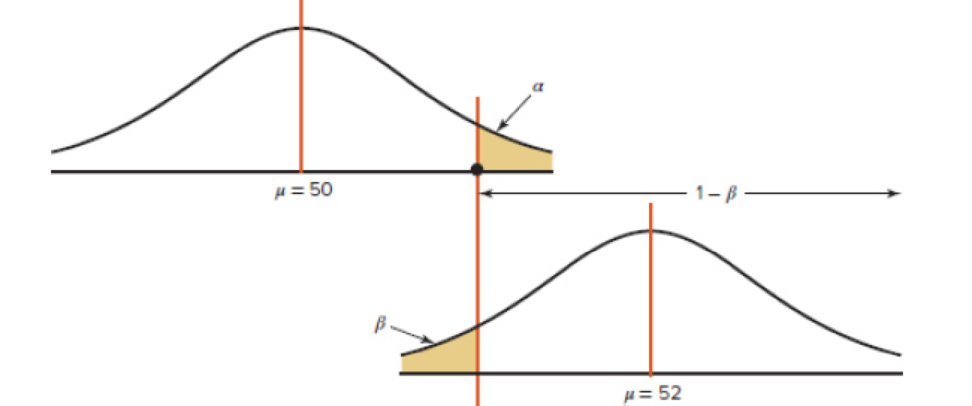
The power of a test (1 − β) can be calculated when a specific value of the
Step 1 For a specific value of α find the corresponding value of
Step 2 Using the value of
Step 3 Subtract this area from 0.5000. This is the value of β.
Step 4 Subtract the value of β from 1. This will give you the power of a test. See Figure 8–41.
1. Find the power of a test, using the hypotheses given previously and α = 0.05, σ = 3, and n = 30.
2. Select several other values for μ in H1 and compute the power of the test. Generalize the results.
FIGURE 8–41 Relationship Among α, β, and the Power of a Test
a.
To obtain: The power of a test, using the given hypotheses and
Answer to Problem 1CTC
The power of test is 0.5222.
Explanation of Solution
Given info:
The hypotheses are
Calculation:
For z score:
Here, the level of significance is 0.05.
The level of significance is 0.05 represents the area of 0.05 to the right of z.
The z score is obtained as follows:
Use Table E: The Standard Normal Distribution to find z score.
Procedure:
- Locate an approximate area of 0.95 in the body of the Table E.
- Move left until the first column and note the values as 1.6.
- Move upward until the top row is reached and note the values as 0.04 and 0.05.
Thus, the z score is 1.645.
For
The formula for finding
Substitute 50 for
For z using alternative hypothesis mean 52:
The formula for finding the z score is,
Substitute 50.901 for
The z score value of –2.01 represents the area to the left of –2.01.
Use Table E: The Standard Normal Distribution to find the area.
Procedure:
- Locate –2.0 in the left column of the table.
- Obtain the value in the corresponding row below 0.01.
That is,
Thus, the area to the left of –2.01 is 0.0222.
For
The value of
Power of a test:
The formula for finding the power of test is,
Substitute 0.4778 for
Thus, the power of test is 0.5222.
b.
To compute: The power of a test for different mean values in alternative hypothesis.
Answer to Problem 1CTC
The power of a test for different mean values in alternative hypothesis is 0.5001.
Explanation of Solution
Given info:
The null hypothesis is
Calculation:
Consider alternative hypothesis
From part (a), the value of
For
For z using alternative hypothesis mean 53:
The formula for finding the z score is,
Substitute 50.901 for
The z score value of –3.83 represents the area to the left of –3.83.
From the Table E, the area of the z score is 0.0001.
That is,
Thus, the area to the left of –3.83 is 0.0001.
For
The value of
Power of a test:
The formula for finding the power of test is,
Substitute 0.4999 for
Thus, the power of test is 0.5001.
For
For z using alternative hypothesis mean 54:
The formula for finding the z score is,
Substitute 50.901 for
The z score value of 3.47 represents the area to the left of 3.47.
From the Table E, the area of the z score is 0.0001.
That is,
Thus, the area to the left of –5.66 is 0.0001.
For
The value of
Power of a test:
The formula for finding the power of test is,
Substitute 0.4999 for
Thus, the power of test is 0.5001.
Want to see more full solutions like this?
Chapter 8 Solutions
Elementary Statistics: A Step By Step Approach


- A marketing agency wants to determine whether different advertising platforms generate significantly different levels of customer engagement. The agency measures the average number of daily clicks on ads for three platforms: Social Media, Search Engines, and Email Campaigns. The agency collects data on daily clicks for each platform over a 10-day period and wants to test whether there is a statistically significant difference in the mean number of daily clicks among these platforms. Conduct ANOVA test. You can provide your answer by inserting a text box and the answer must include: also please provide a step by on getting the answers in excel Null hypothesis, Alternative hypothesis, Show answer (output table/summary table), and Conclusion based on the P value.arrow_forwardA company found that the daily sales revenue of its flagship product follows a normal distribution with a mean of $4500 and a standard deviation of $450. The company defines a "high-sales day" that is, any day with sales exceeding $4800. please provide a step by step on how to get the answers Q: What percentage of days can the company expect to have "high-sales days" or sales greater than $4800? Q: What is the sales revenue threshold for the bottom 10% of days? (please note that 10% refers to the probability/area under bell curve towards the lower tail of bell curve) Provide answers in the yellow cellsarrow_forwardBusiness Discussarrow_forward
- The following data represent total ventilation measured in liters of air per minute per square meter of body area for two independent (and randomly chosen) samples. Analyze these data using the appropriate non-parametric hypothesis testarrow_forwardeach column represents before & after measurements on the same individual. Analyze with the appropriate non-parametric hypothesis test for a paired design.arrow_forwardShould you be confident in applying your regression equation to estimate the heart rate of a python at 35°C? Why or why not?arrow_forward
 Glencoe Algebra 1, Student Edition, 9780079039897...AlgebraISBN:9780079039897Author:CarterPublisher:McGraw Hill
 Mathematics For Machine TechnologyAdvanced MathISBN:9781337798310Author:Peterson, John.Publisher:Cengage Learning,
 College AlgebraAlgebraISBN:9781305115545Author:James Stewart, Lothar Redlin, Saleem WatsonPublisher:Cengage Learning
 Algebra and Trigonometry (MindTap Course List)AlgebraISBN:9781305071742Author:James Stewart, Lothar Redlin, Saleem WatsonPublisher:Cengage Learning
 Functions and Change: A Modeling Approach to Coll...AlgebraISBN:9781337111348Author:Bruce Crauder, Benny Evans, Alan NoellPublisher:Cengage Learning
 Linear Algebra: A Modern IntroductionAlgebraISBN:9781285463247Author:David PoolePublisher:Cengage Learning