Concept explainers
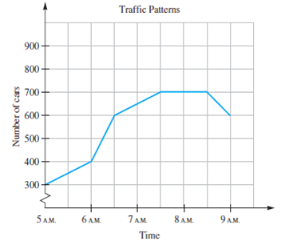
The following graph shows the relationship between the numbers of cars on a certain road and the time of day for times between

a. What was the increase in the number of cars on the road between
b. During which half hour was the increase in the number of cars the greatest?
c. What was the increase in the number of cars between
d. During which half hour(s) did the numbers of cars decrease? By how much?
e. The graph for this problem is composed of segments rather than just points. Why do you think segments are used here instead of just points?
Want to see the full answer?
Check out a sample textbook solution
Chapter 8 Solutions
A Problem Solving Approach To Mathematics For Elementary School Teachers, Loose Leaf Edition Plus Mylab Math With Pearson Etext -- 18 Week Access Card Package (13th Edition)
 Glencoe Algebra 1, Student Edition, 9780079039897...AlgebraISBN:9780079039897Author:CarterPublisher:McGraw Hill
 Elementary AlgebraAlgebraISBN:9780998625713Author:Lynn Marecek, MaryAnne Anthony-SmithPublisher:OpenStax - Rice University
 Functions and Change: A Modeling Approach to Coll...AlgebraISBN:9781337111348Author:Bruce Crauder, Benny Evans, Alan NoellPublisher:Cengage Learning
 Holt Mcdougal Larson Pre-algebra: Student Edition...AlgebraISBN:9780547587776Author:HOLT MCDOUGALPublisher:HOLT MCDOUGAL
 Trigonometry (MindTap Course List)TrigonometryISBN:9781337278461Author:Ron LarsonPublisher:Cengage Learning
 Algebra: Structure And Method, Book 1AlgebraISBN:9780395977224Author:Richard G. Brown, Mary P. Dolciani, Robert H. Sorgenfrey, William L. ColePublisher:McDougal Littell


