
Videos
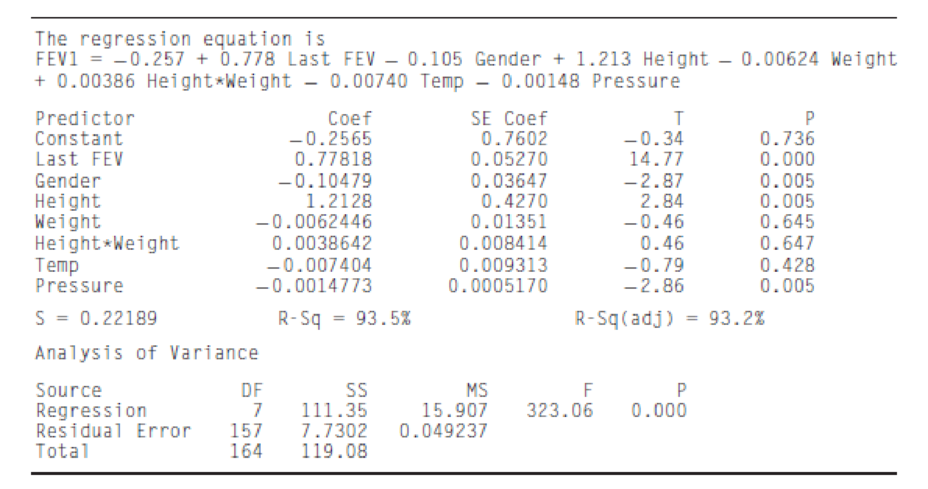
(Continues Exercise 7 in Section 8.1.) To try to improve the prediction of FEV1, additional independent variables are included in the model. These new variables are Weight (in kg), the product (interaction) of Height and Weight, and the ambient temperature (in °C). The following MINITAB output presents results of fitting the model
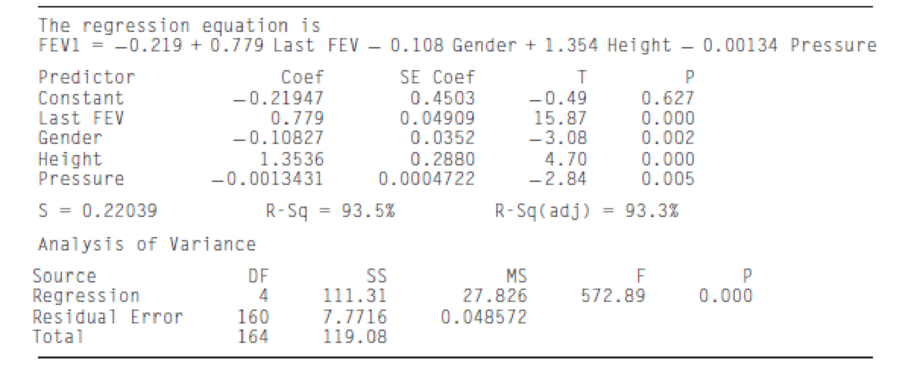
- a. The following MINITAB output, reproduced from Exercise 7 in Section 8.1, is for a reduced model in which Weight, Height·Weight, and Temp have been dropped. Compute the F statistic for testing the plausibility of the reduced model.
- b. How many degrees of freedom does the F statistic have?
- c. Find the P-value for the F statistic. Is the reduced model plausible?
- d. Someone claims that since each of the variables being dropped had large P-values, the reduced model must be plausible, and it was not necessary to perform an F test. Is this correct? Explain why or why not.
Want to see the full answer?
Check out a sample textbook solution
Chapter 8 Solutions
Statistics for Engineers and Scientists (Looseleaf)
Additional Math Textbook Solutions
A First Course in Probability (10th Edition)
Elementary Statistics ( 3rd International Edition ) Isbn:9781260092561
APPLIED STAT.IN BUS.+ECONOMICS
University Calculus
Mathematics for the Trades: A Guided Approach (11th Edition) (What's New in Trade Math)
Elementary Statistics: Picturing the World (7th Edition)


- A survey of 581 citizens found that 313 of them favor a new bill introduced by the city. We want to find a 95% confidence interval for the true proportion of the population who favor the bill. What is the lower limit of the interval? Enter the result as a decimal rounded to 3 decimal digits. Your Answer:arrow_forwardLet X be a continuous RV with PDF where a > 0 and 0 > 0 are parameters. verify that f-∞ /x (x)dx = 1. Find the CDF, Fx (7), of X.arrow_forward6. [20] Let X be a continuous RV with PDF 2(1), 1≤x≤2 fx(x) = 0, otherwisearrow_forward
- A survey of 581 citizens found that 313 of them favor a new bill introduced by the city. We want to find a 95% confidence interval for the true proportion of the population who favor the bill. What is the lower limit of the interval? Enter the result as a decimal rounded to 3 decimal digits. Your Answer:arrow_forwardA survey of 581 citizens found that 313 of them favor a new bill introduced by the city. We want to find a 95% confidence interval for the true proportion of the population who favor the bill. What is the lower limit of the interval? Enter the result as a decimal rounded to 3 decimal digits. Your Answer:arrow_forward2. The SMSA data consisting of 141 observations on 10 variables is fitted by the model below: 1 y = Bo+B1x4 + ẞ2x6 + ẞ3x8 + √1X4X8 + V2X6X8 + €. See Question 2, Tutorial 3 for the meaning of the variables in the above model. The following results are obtained: Estimate Std. Error t value Pr(>|t|) (Intercept) 1.302e+03 4.320e+02 3.015 0.00307 x4 x6 x8 x4:x8 x6:x8 -1.442e+02 2.056e+01 -7.013 1.02e-10 6.340e-01 6.099e+00 0.104 0.91737 -9.455e-02 5.802e-02 -1.630 0.10550 2.882e-02 2.589e-03 11.132 1.673e-03 7.215e-04 2.319 F) x4 1 3486722 3486722 17.9286 4.214e-05 x6 1 14595537 x8 x4:x8 x6:x8 1 132.4836 < 2.2e-16 1045693 194478 5.3769 0.02191 1 1198603043 1198603043 6163.1900 < 2.2e-16 1 25765100 25765100 1045693 Residuals 135 26254490 Estimated variance matrix (Intercept) x4 x6 x8 x4:x8 x6:x8 (Intercept) x4 x6 x8 x4:x8 x6:x8 0.18875694 1.866030e+05 -5.931735e+03 -2.322825e+03 -16.25142055 0.57188953 -5.931735e+03 4.228816e+02 3.160915e+01 0.61621781 -0.03608028 -0.00445013 -2.322825e+03…arrow_forward
- In some applications the distribution of a discrete RV, X resembles the Poisson distribution except that 0 is not a possible value of X. Consider such a RV with PMF where 1 > 0 is a parameter, and c is a constant. (a) Find the expression of c in terms of 1. (b) Find E(X). (Hint: You can use the fact that, if Y ~ Poisson(1), the E(Y) = 1.)arrow_forwardSuppose that X ~Bin(n,p). Show that E[(1 - p)] = (1-p²)".arrow_forwardI need help with this problem and an explanation of the solution for the image described below. (Statistics: Engineering Probabilities)arrow_forward
- I need help with this problem and an explanation of the solution for the image described below. (Statistics: Engineering Probabilities)arrow_forwardThis exercise is based on the following data on four bodybuilding supplements. (Figures shown correspond to a single serving.) Creatine(grams) L-Glutamine(grams) BCAAs(grams) Cost($) Xtend(SciVation) 0 2.5 7 1.00 Gainz(MP Hardcore) 2 3 6 1.10 Strongevity(Bill Phillips) 2.5 1 0 1.20 Muscle Physique(EAS) 2 2 0 1.00 Your personal trainer suggests that you supplement with at least 10 grams of creatine, 39 grams of L-glutamine, and 90 grams of BCAAs each week. You are thinking of combining Xtend and Gainz to provide you with the required nutrients. How many servings of each should you combine to obtain a week's supply that meets your trainer's specifications at the least cost? (If an answer does not exist, enter DNE.) servings of xtend servings of gainzarrow_forwardI need help with this problem and an explanation of the solution for the image described below. (Statistics: Engineering Probabilities)arrow_forward
 Linear Algebra: A Modern IntroductionAlgebraISBN:9781285463247Author:David PoolePublisher:Cengage Learning