
Videos
The November 24, 2001, issue of The Economist published economic data for 15 industrialized nations. Included were the percent changes in gross domestic product (GDP), industrial production (IP), consumer prices (CP), and producer prices (PP) from Fall 2000 to Fall 2001, and the unemployment rate in Fall 2001 (UNEMP). An economist wants to construct a model to predict GDP from the other variables. A fit of the model
yields the following output:
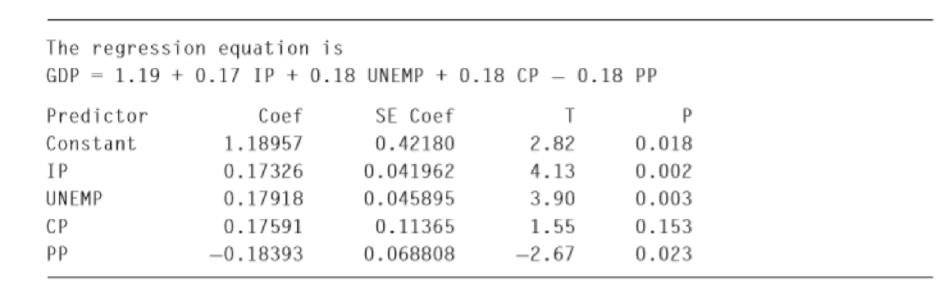
- a. Predict the percent change in GDP for a country with IP = 0.5, UNEMP = 5.7, CP = 3.0, and PP = 4.1.
- b. If two countries differ in unemployment rate by 1%, by how much would you predict their percent changes in GDP to differ, other things being equal?
- c. CP and PP are both measures of the inflation rate. Which one is more useful in predicting GDP? Explain.
- d. The producer price index for Sweden in September 2000 was 4.0, and for Austria it was 6.0. Other things being equal, for which country would you expect the percent change in GDP to be larger? Explain.

Trending nowThis is a popular solution!

Chapter 8 Solutions
Statistics for Engineers and Scientists (Looseleaf)
Additional Math Textbook Solutions
Math in Our World
College Algebra (7th Edition)
Intermediate Algebra (13th Edition)
APPLIED STAT.IN BUS.+ECONOMICS
University Calculus
University Calculus: Early Transcendentals (4th Edition)


- Good Day, Kindly assist with the followingarrow_forwardcan you help me for my assignmentarrow_forwardThe data represents the heights of eruptions by a geyser. Height of eruption (in.) 64 37 50 900 80 50 40 70 50 61 78 55 78 53 64 70 64 60 40 89 Part 1 of 2 ○ Points: 0 of 1 Use the heights to construct a stemplot. Identify the two values that are closest to the middle when the data are sorted in order from lowest to highest. Which plot represents a stemplot of the data? A. 3 7 400 500035 6 01444 70088 8 09 90 ew an example Get more help - O B. 3003 4045 5 001 6004 7004 8088 909 Macbook Pres ○ C. 3 7 4 014445 50088 6009 70003 80 90 Clear allarrow_forward
- The least-squares method refers to: A. Determining smallest sources of error in a forecast B. Time series decomposition C. The logic used in linear regression D. Calculating the sum of forecast errorsarrow_forwardWhy an interval estimate for the population is preferred to a point estimate? Discuss In real business practices, do researchers always have knowledge of or know the population mean, under study? If Yes, discuss. If No, discuss. There is no difference(s) between an interval estimate and a confidence interval estimate. If true , explain. If false, explain. How does this relate to sampling distribution and casuality?arrow_forwardPlease answer exercise 11.7.1 and exercise 11.7.2 step by step showing all details involvedarrow_forward
- The following table shows the IQs of 480 elementary school children. Determine the four moments (mean, standard deviation, asymmetry, and skewness). Class mark (X) 70 74 78 82 86 90 94 98 102 106 110 114 118 122 126 Frequencies (f) 4 9 16 28 45 66 85 72 54 38 27 18 11 5 2arrow_forwardCalculate the respective coefficients of variation. Compare the results in each problem: Pulse Rates Listed below are the pulse rates (beats per minute) for samples of adult men and women (from Data Set 1 "Body Data" in Appendix B). Does there appear to be a difference? Men: 86 72 64 72 72 54 66 56 80 72 64 64 96 58 66 Women: 64 84 82 70 74 86 90 88 90 90 94 68 90 82 80 Lines at the Bank Customer wait times (in seconds) at the Madison Savings Bank are recorded using two configurations: single customer line; individual customer lines. Single Line 390 396 402 408 426 438 444 462 462 462 Individual Lines 252 324 348 372 402 462 462 510 558 600arrow_forwardThe following ordered data listing shows the data rates for cellular phones for a telephone company at an airport. a) Calculate the measures of central tendency for the list of unclustered data. b) group the data in an appropriate frequency table. c) calculate the measures of central tendency using the table resulting from b). 0.8 1.4 1.8 1.9 3.2 3.6 4.5 4.5 4.6 6.2 6.5 7.7 7.9 9.9 10.2 10.3 10.9 11.1 11.1 11.6 11.8 12.0 13.1 13.5 13.7 14.1 14.2 14.7 15.0 15.1 15.5 15.8 16.0 17.5 18.2 20.2 21.1 21.5 22.2 22.4 23.1 24.5 25.7 28.5 34.6 38.5 43.0 55.6 71.3 77.8arrow_forward
 Big Ideas Math A Bridge To Success Algebra 1: Stu...AlgebraISBN:9781680331141Author:HOUGHTON MIFFLIN HARCOURTPublisher:Houghton Mifflin Harcourt
 Linear Algebra: A Modern IntroductionAlgebraISBN:9781285463247Author:David PoolePublisher:Cengage Learning
 Functions and Change: A Modeling Approach to Coll...AlgebraISBN:9781337111348Author:Bruce Crauder, Benny Evans, Alan NoellPublisher:Cengage Learning
 College AlgebraAlgebraISBN:9781305115545Author:James Stewart, Lothar Redlin, Saleem WatsonPublisher:Cengage Learning
 Algebra and Trigonometry (MindTap Course List)AlgebraISBN:9781305071742Author:James Stewart, Lothar Redlin, Saleem WatsonPublisher:Cengage Learning