
Videos
a)
To explain why it is necessary to inspect a graph of the sample data when checking the Normal/Large Sample condition.
a)
Answer to Problem 75E
As
Explanation of Solution
The sample data contained 10 sample values which is less than 30. Therefore, it was necessary to inspect a graph of the sample data to make sure that the Normal/Large sample condition is satisfied. So, we need to check if the population distribution is approximately Normal and the shape of the distribution.
b)
To explain whether there is convincing evidence that the average number of pepperonis is less than 40.
b)
Answer to Problem 75E
There is no convincing evidence that the average number of pepperonis is less than 40.
Explanation of Solution
Given:
Number of pepperonis on each pizza:
| 47 | 36 | 25 | 37 | 46 | 36 | 49 | 32 | 32 | 34 |
Calculation:
Using excel,
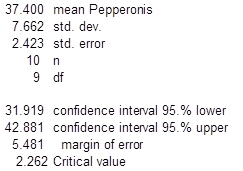
Hence, the 95% confidence interval for true mean number of pepperonis on each pizza:
Decision: The upper confidence limit is 42.881 which is higher than 40.
Conclusion: Therefore, there is no convincing evidence that the average number of pepperonis is less than 40.
Chapter 8 Solutions
PRACTICE OF STATISTICS F/AP EXAM
Additional Math Textbook Solutions
Elementary Statistics: Picturing the World (7th Edition)
Calculus for Business, Economics, Life Sciences, and Social Sciences (14th Edition)
University Calculus: Early Transcendentals (4th Edition)
Calculus: Early Transcendentals (2nd Edition)
Elementary Statistics (13th Edition)


- please find the answers for the yellows boxes using the information and the picture belowarrow_forwardA marketing agency wants to determine whether different advertising platforms generate significantly different levels of customer engagement. The agency measures the average number of daily clicks on ads for three platforms: Social Media, Search Engines, and Email Campaigns. The agency collects data on daily clicks for each platform over a 10-day period and wants to test whether there is a statistically significant difference in the mean number of daily clicks among these platforms. Conduct ANOVA test. You can provide your answer by inserting a text box and the answer must include: also please provide a step by on getting the answers in excel Null hypothesis, Alternative hypothesis, Show answer (output table/summary table), and Conclusion based on the P value.arrow_forwardA company found that the daily sales revenue of its flagship product follows a normal distribution with a mean of $4500 and a standard deviation of $450. The company defines a "high-sales day" that is, any day with sales exceeding $4800. please provide a step by step on how to get the answers Q: What percentage of days can the company expect to have "high-sales days" or sales greater than $4800? Q: What is the sales revenue threshold for the bottom 10% of days? (please note that 10% refers to the probability/area under bell curve towards the lower tail of bell curve) Provide answers in the yellow cellsarrow_forward
- Business Discussarrow_forwardThe following data represent total ventilation measured in liters of air per minute per square meter of body area for two independent (and randomly chosen) samples. Analyze these data using the appropriate non-parametric hypothesis testarrow_forwardeach column represents before & after measurements on the same individual. Analyze with the appropriate non-parametric hypothesis test for a paired design.arrow_forward
- Should you be confident in applying your regression equation to estimate the heart rate of a python at 35°C? Why or why not?arrow_forwardGiven your fitted regression line, what would be the residual for snake #5 (10 C)?arrow_forwardCalculate the 95% confidence interval around your estimate of r using Fisher’s z-transformation. In your final answer, make sure to back-transform to the original units.arrow_forward
 MATLAB: An Introduction with ApplicationsStatisticsISBN:9781119256830Author:Amos GilatPublisher:John Wiley & Sons Inc
 Probability and Statistics for Engineering and th...StatisticsISBN:9781305251809Author:Jay L. DevorePublisher:Cengage Learning
 Statistics for The Behavioral Sciences (MindTap C...StatisticsISBN:9781305504912Author:Frederick J Gravetter, Larry B. WallnauPublisher:Cengage Learning
 Elementary Statistics: Picturing the World (7th E...StatisticsISBN:9780134683416Author:Ron Larson, Betsy FarberPublisher:PEARSON
 The Basic Practice of StatisticsStatisticsISBN:9781319042578Author:David S. Moore, William I. Notz, Michael A. FlignerPublisher:W. H. Freeman
 Introduction to the Practice of StatisticsStatisticsISBN:9781319013387Author:David S. Moore, George P. McCabe, Bruce A. CraigPublisher:W. H. Freeman