
Concept explainers
Videos
a)
Interpretation: Determine the order policy for the item based on silver-meal method.
Concept Introduction: Silver-Meal method is mainly used to determine the production quantities of the firm to be produced at the minimum cost.it is also provides the appropriate solutions to the time varying demand in production patterns.
a)
Answer to Problem 14P
The order policy according to silver meal method is 18 units in period-1,23 units in Period-4,50 units in Period-6,35 units in period-9 and 12 units in period-12.
Explanation of Solution
Given information: The anticipated demand for an inventory is as follows:
| Month | 1 | 2 | 3 | 4 | 5 | 6 | 7 | 8 | 9 | 10 | 11 | 12 |
| Demand | 6 | 12 | 4 | 8 | 15 | 25 | 20 | 5 | 10 | 20 | 5 | 12 |
Current inventory is 4 and ending inventory is 8.
Holding cost (h) is $1 per period, set up cost (K) is $40
The objective of this method is to minimize the per-period-cost of ordering policy.
Net Requirements:
The order policy (lot-size) of the item under silver meal method can be calculated as follows:
According to silver meal method the average cost per period C (T) is a function of the average holding and set up cost per period for T number of Periods. The production in period 1 is equal to the demand in that period 1 to incur the order cost K.
Hence
And
And general equation is
Once
Now, calculate the order policy using the above formula as follows:
Starting in period 1:
Stop the process since
Starting in period 4:
Stop the process since
Starting in period 6:
Stop the process since
Starting in period 9:
Stop the process since
The same is explained with the help of a table shown below:
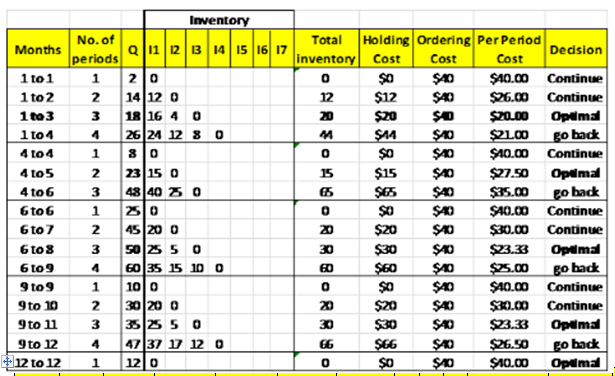
Table 1: Order Quantity using Silver-Meal Method:
| Months | No.of periods | Q | 11 | 12 | 13 | 14 | 15 | 16 | 17 | Total inventory | Holding Cost | Ordering Cost | Per Period Cost | Decision |
| 1 to 1 | 1 | 2 | 0 | =SUM(D3:J3) | =K3*1 | 40 | =SUM((L3:M3)/B3) | Continue | ||||||
| 1 to 2 | 2 | =2+12 | 12 | 0 | =SUM(D4:J4) | =K4*1 | 40 | =SUM((L4:M4)/B4) | Continue | |||||
| 1 to 3 | 3 | =14+4 | =C5-C3 | =C5-C4 | 0 | =SUM(D5:J5) | =K5*1 | 40 | =SUM((L5:M5)/B5) | Optimal | ||||
| 1 to 4 | 4 | =C5+8 | =C6-C3 | =C6-C4 | =C6-C5 | 0 | =SUM(D6:J6) | =K6*1 | 40 | =SUM((L6:M6)/B6) | Go Back | |||
| 4 to 4 | 1 | 8 | 0 | =SUM(D7:J7) | =K7*1 | 40 | =SUM((L7:M7)/B7) | Continue | ||||||
| 4 to 5 | 2 | =C7+15 | =C8-C7 | 0 | =SUM(D8:J8) | =K8*1 | 40 | =SUM((L8:M8)/B8) | Optimal | |||||
| 4 to 6 | 3 | =C8+25 | =C9-C7 | =C9-C8 | 0 | =SUM(D9:J9) | =K9*1 | 40 | =SUM((L9:M9)/B9) | Go Back | ||||
| 6 to 6 | 1 | 25 | 0 | =SUM(D10:J10) | =K10*1 | 40 | =SUM((L10:M10)/B10) | Continue | ||||||
| 6to 7 | 2 | =C10+20 | =C11-C10 | 0 | =SUM(D11:J11) | =K11*1 | 40 | =SUM((L11:M11)/B11) | Continue | |||||
| 6 to 8 | 3 | =C11+5 | =C12-C10 | =C12-C11 | 0 | =SUM(D12:J12) | =K12*1 | 40 | =SUM((L12:M12)/B12) | Optimal | ||||
| 6 to 9 | 4 | =C12+10 | =C13--C10 | =C13-C11 | =C13-C12 | =C13-C13 | =SUM(D13:J13) | =K13*1 | 40 | =SUM((L13:M13)/B13) | Go Back | |||
| 9 to 9 | 1 | 10 | 0 | =SUM(D14:J14) | =K14*1 | 40 | =SUM((L14:M14)/B14) | Continue | ||||||
| 9 to 10 | 2 | =C14+20 | =C15-C14 | 0 | =SUM(D15:J15) | =K15*1 | 40 | =SUM((L15:M15)/B15) | Continue | |||||
| 9 to 11 | 3 | =C15+5 | =C16-C14 | =C16-C15 | 0 | =SUM(D16:J16) | =K16*1 | 40 | =SUM((L16:M16)/B16) | Optimal | ||||
| 9 to 12 | 4 | =C16+12 | =C17--C14 | =C17-C15 | =C17-C16 | =C17-C17 | =SUM(D17:J17) | =K17*1 | 40 | =SUM((L17:M17)/B17) | Go Back | |||
| 12 to 12 | 1 | 12 | 0 | =SUM(D18:J18) | =K18*1 | 40 | =SUM((L18:M18)/B18) | Optimal |
b)
Interpretation: Determine the order policy for the item based on Least Unit Cost method.
Concept Introduction: Least unit cost produced the demand of the present periods based on the trial basis, yield the future periods. The method is calculated by adding the setup cost and carrying inventory cost and finally find the smallest cost per unit.
b)
Answer to Problem 14P
The order policy according to LUC method is 26 units in period-1, 40 units in Period-5, 25 units in Period-7, 35 units in period-9 and 12 units in period-12.
Explanation of Solution
Given information: The anticipated demand for a component VC is as follows:
| Month | 1 | 2 | 3 | 4 | 5 | 6 | 7 | 8 | 9 | 10 |
| Demand | 42 | 42 | 32 | 12 | 26 | 112 | 45 | 14 | 76 | 38 |
Holding cost (h) is $0.60 per period, set up cost (K) is $132
The order policy (lot-size) of the item under Least Unit Cost(LUC)method can be calculated as follows:
LUC divides the average cost per period C (T) by the total number of units demanded. Hence
And
And general equation is
Once
Starting from period 1
Stop the process since
Starting in period 5:
Stop the process since
Starting in period 7:
Stop the process since
Starting in period 9:
Stop the process since
The same is explained with the help of a table shown below:
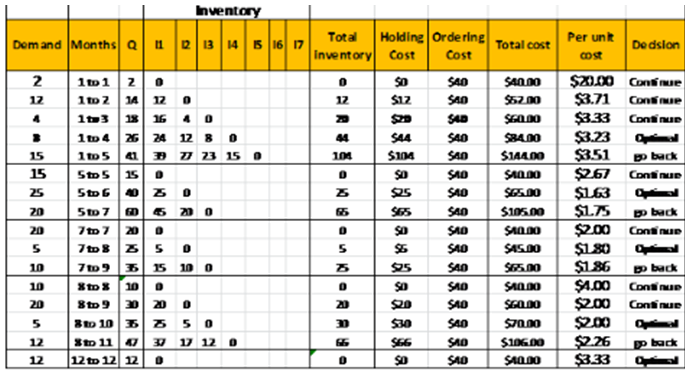
Table 2: Order Quantity using Least-Unit-Cost Method:
| Demand | Months | Q | 11 | 12 | 13 | 14 | 15 | Total inventory | Holding Cost | Ordering Cost | Total Cost | Per Period Cost | Decision |
| 2 | 1 to 1 | =A3 | 0 | =SUM(D3:H3) | =L3*1 | 40 | =K3+J3 | =L3/C3 | Continue | ||||
| 12 | 1 to 2 | =C3+A4 | =C4-C3 | 0 | =SUM(D4:H4) | =L4*1 | 40 | =K4+J4 | =L4/C4 | Continue | |||
| 4 | 1 to 3 | =C4+A5 | =C5-C3 | =C5-C4 | 0 | =SUM(D5:H5) | =L5*1 | 40 | =K5+J5 | =L5/C5 | Continue | ||
| 8 | 1 to 4 | =C5+A6 | =C6-C3 | =C6-C4 | =C6-C5 | =C6-C6 | =SUM(D6:H6) | =L6*1 | 40 | =K6+J6 | =L6/C6 | Optimal | |
| 15 | 1 to 5 | =C6+A7 | =C7-C3 | =C7-C4 | =C7-C5 | =C7-C6 | =C7-C7 | =SUM(D7:H7) | =L7*1 | =K7+J7 | =L7/C7 | Go Back | |
| 15 | 5 to 5 | =A8 | 0 | =SUM(D8:H8) | =L8*1 | 40 | =K8+J8 | =L8/C8 | Continue | ||||
| 25 | 5 to 6 | =C8+A9 | =C9-C8 | 0 | =SUM(D9:H9) | =L9*1 | 40 | =K9+J8 | =L9/C9 | Optimal | |||
| 20 | 5 to 7 | =C9+A11 | =C10-C8 | =C10-C9 | =C10-C10 | =SUM(D10:H10) | =L10*1 | 40 | =K10+J10 | =L10/C10 | Go Back | ||
| 20 | 7 to 7 | =A11 | 0 | =SUM(D11:H11) | =L11*1 | 40 | =K11+J11 | =L11/C11 | Continue | ||||
| 5 | 7 to 8 | =C11+A12 | =C12-C11 | 0 | =SUM(D12:H12) | =L12*1 | 40 | =K12+J12 | =L12/C12 | Optimal | |||
| 10 | 7 to 9 | =C12+A13 | =C13-C11 | =C13-C12 | =C13-C13 | =SUM(D13:H13) | =L13*1 | 40 | =K13+J13 | =L13/C13 | Go Back | ||
| 10 | 8 to 8 | =A14 | 0 | =SUM(D14:H14) | =L14*1 | 40 | =K14+J14 | =L14/C14 | Continue | ||||
| 20 | 8 to 9 | =C14+A15 | =C15-C14 | 0 | =SUM(D15:H15) | =L15*1 | 40 | =K15+J15 | =L15/C15 | Continue | |||
| 5 | 8 to 10 | =C15+A16 | =C16-C14 | =C16-C15 | 0 | =SUM(D16:H16) | =L16*1 | 40 | =K16+J16 | =L16/C16 | Optimal | ||
| 12 | 8 to 11 | =C16+A17 | =C17-C14 | =C17-C15 | -C17-C16 | =C17-C17 | =SUM(D17:H17) | =L17*1 | 40 | =K17+J17 | =L17/C17 | Go Back | |
| 12 | 12 to 12 | 12 | 0 | =SUM(D18:H18) | =L18*1 | 40 | =K18+J18 | ==L18/C18 | Optimal |
c)
Interpretation: Determine the order policy for the item based on Part Period Balancing method.
Concept Introduction: Part Period Balancing method is the lot-size method which use the starting and ending of the process function to consider the multiple periods to modifying the calculation based on the least total cost.
c)
Answer to Problem 14P
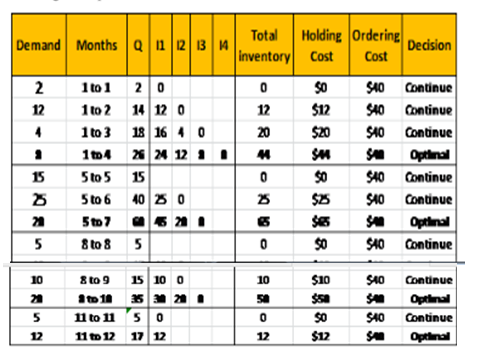
The order policy according to part period balancing method is 26 units in period-1, 60 units in Period-5, 35 units in Period-8, 17 units in period-11.
Explanation of Solution
Given information: The anticipated demand for a component VC is as follows:
| Month | 1 | 2 | 3 | 4 | 5 | 6 | 7 | 8 | 9 | 10 |
| Demand | 42 | 42 | 32 | 12 | 26 | 112 | 45 | 14 | 76 | 38 |
Holding cost (h) is $0.60 per period, set up cost (K) is $132
The order policy (lot size) according to part period balancing method can be calculated as follows:
In this method the order horizon that equates holding and setup cost over that period has to be calculated as follows:
Starting from Period 1
d)
Interpretation: Determine the three lot-sizing method resulted in the lowest cost for the 12 periods.
Concept Introduction: Lot size is determined the quantity order during the production time. The size of the lot may be dynamic or fixed.ERP (Enterprise Resource Planning) is the inbuilt multiple heuristic methods to determine the size of the lot to the production unit.
d)
Answer to Problem 14P
The Silver-meal method is giving lowest cost.
Explanation of Solution
Given information: The anticipated demand for a component VC is as follows:
| Month | 1 | 2 | 3 | 4 | 5 | 6 | 7 | 8 | 9 | 10 |
| Demand | 42 | 42 | 32 | 12 | 26 | 112 | 45 | 14 | 76 | 38 |
Holding cost (h) is $0.60 per period, set up cost (K) is $132
Calculate the total cost of the ordering for the three methods as shown below:
| Silver-meal | Least Unit Cost | Part Period Balancing | |
| Holding Cost | =20+15+30+30 | =44+25+5+30 | =44+65+50+12 |
| Setup Cost | =40*5 | =40*5 | =4*40 |
| Total Cost | =B3+B2 | =C3+C2 | =D3+D2 |
| Silver-meal | Least Unit Cost | Part Period Balancing | |
| Holding Cost | 95 | 104 | 171 |
| Setup Cost | 200 | 200 | 160 |
| Total Cost | 295 | 304 | 331 |
Want to see more full solutions like this?
Chapter 8 Solutions
EBK PRODUCTION AND OPERATIONS ANALYSIS


- Employee In-Service Training ASSIGNMENT: In-Service Training. The intern is required to plan and implement two in-service training sessions for employees. Each in-service should last at least 10 but not more than 30 minutes and should be given to all employees affected. The preceptor or supervisor/unit manager must approve all in-service topics. 1) One presentation should be related to a policy or procedure of any kind (e.g. proper use of equipment); 2) The second presentation must be related to sanitation or safety. For each in-service presentation, the intern must develop a written class plan and a visual aid (may be a handout, poster, PowerPoint slide presentation, etc.) appropriate to the life experiences, cultural diversity and educational background of the target audience. The intern must also measure behavior change. Note, this cannot be measured by a written pre- and post- test. That would be measuring knowledge. The intern mustactually observe and document that the learners…arrow_forwardFor a dietary manager in a nursing home to train a dietary aidearrow_forwardDietary Management in a Nursing Home. As detailed as possible.arrow_forward
- For dietary management in a nursing home. As detailed as possible.arrow_forwardA small furniture manufacturer produces tables and chairs. Each product must go through three stages of the manufacturing process – assembly, finishing, and inspection. Each table requires 3 hours of assembly, 2 hours of finishing, and 1 hour of inspection. The profit per table is $120 while the profit per chair is $80. Currently, each week there are 200 hours of assembly time available, 180 hours of finishing time, and 40 hours of inspection time. Linear programming is to be used to develop a production schedule. Define the variables as follows: T = number of tables produced each week C= number of chairs produced each week According to the above information, what would the objective function be? (a) Maximize T+C (b) Maximize 120T + 80C (c) Maximize 200T+200C (d) Minimize 6T+5C (e) none of the above According to the information provided in Question 17, which of the following would be a necessary constraint in the problem? (a) T+C ≤ 40 (b) T+C ≤ 200 (c) T+C ≤ 180 (d) 120T+80C ≥ 1000…arrow_forwardAs much detail as possible. Dietary Management- Nursing Home Don't add any fill-in-the-blanksarrow_forward
- Menu Planning Instructions Use the following questions and points as a guide to completing this assignment. The report should be typed. Give a copy to the facility preceptor. Submit a copy in your Foodservice System Management weekly submission. 1. Are there any federal regulations and state statutes or rules with which they must comply? Ask preceptor about regulations that could prescribe a certain amount of food that must be kept on hand for emergencies, etc. Is the facility accredited by any agency such as Joint Commission? 2. Describe the kind of menu the facility uses (may include standard select menu, menu specific to station, non-select, select, room service, etc.) 3. What type of foodservice does the facility have? This could be various stations to choose from, self-serve, 4. conventional, cook-chill, assembly-serve, etc. Are there things about the facility or system that place a constraint on the menu to be served? Consider how patients/guests are served (e.g. do they serve…arrow_forwardWork with the chef and/or production manager to identify a menu item (or potential menu item) for which a standardized recipe is needed. Record the recipe with which you started and expand it to meet the number of servings required by the facility. Develop an evaluation rubric. Conduct an evaluation of the product. There should be three or more people evaluating the product for quality. Write a brief report of this activity • Product chosen and the reason why it was selected When and where the facility could use the product The standardized recipe sheet or card 。 o Use the facility's format or Design one of your own using a form of your choice; be sure to include the required elements • • Recipe title Yield and portion size Cooking time and temperature Ingredients and quantities Specify AP or EP Procedures (direction)arrow_forwardASSIGNMENT: Inventory, Answer the following questions 1. How does the facility survey inventory? 2. Is there a perpetual system in place? 3. How often do they do a physical inventory? 4. Participate in taking inventory. 5. Which type of stock system does the facility use? A. Minimum stock- includes a safety factor for replenishing stock B. Maximum stock- equal to a safety stock plus estimated usage (past usage and forecasts) C. Mini-max-stock allowed to deplete to a safety level before a new order is submitted to bring up inventory up to max again D. Par stock-stock brought up to the par level each time an order is placed regardless of the amount on hand at the time of order E. Other-(describe) Choose an appropriate product and determine how much of an item should be ordered. Remember the formula is: Demand during lead time + safety stock = amount to order Cost out an inventory according to data supplied. Remember that to do this, you will need to take an inventory, and will need to…arrow_forward
 Purchasing and Supply Chain ManagementOperations ManagementISBN:9781285869681Author:Robert M. Monczka, Robert B. Handfield, Larry C. Giunipero, James L. PattersonPublisher:Cengage Learning
 Practical Management ScienceOperations ManagementISBN:9781337406659Author:WINSTON, Wayne L.Publisher:Cengage,
- MarketingMarketingISBN:9780357033791Author:Pride, William MPublisher:South Western Educational Publishing