Modern Database Management
13th Edition
ISBN: 9780134792293
Author: Hoffer
Publisher: PEARSON
expand_more
expand_more
format_list_bulleted
Concept explainers
Textbook Question
Chapter 8, Problem 8.67PAE
Problems and Exercises 8-65i5 through 8-68 refer to the large Pine Valley Furniture Company data set provided with the text.
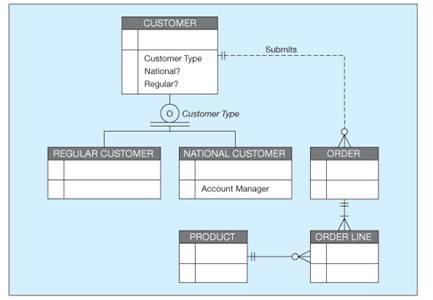
8-67. Consider the EER diagram for Pine Valley Furniture shown in Figure 3-12. Figure 8-15 looks at a portion of that EER diagram.

Figure 8-15 Figure for Problem and Exercise 8-67
Let’s make a few assumptions about the average usage of the system:
- There are 60,000 customers, and of these, 85 percent represent regular accounts and 15 percent national accounts.
- Currently, the system stores 2,500,000 orders, although this number is constantly changing.
- Each order has an average of 30 products.
- There are 5,000 products.
- Approximately 1,500 orders are placed per hour.
- Based on these assumptions, draw a usage map for this portion of the EER diagram.
- Management would like employees only to use this
database Do you see any opportunities for denormalization?
Expert Solution & Answer
Want to see the full answer?
Check out a sample textbook solution
Students have asked these similar questions
I cannot program smart home automation rules from my device using a computer or phone, and I would like to know how to properly connect devices such as switches and sensors together ?
Cisco Packet Tracer
1. Smart Home Automation:o Connect a temperature sensor and a fan to a home gateway.o Configure the home gateway so that the fan is activated when the temperature exceedsa set threshold (e.g., 30°C).2. WiFi Network Configuration:o Set up a wireless LAN with a unique SSID.o Enable WPA2 encryption to secure the WiFi network.o Implement MAC address filtering to allow only specific clients to connect.3. WLC Configuration:o Deploy at least two wireless access points connected to a Wireless LAN Controller(WLC).o Configure the WLC to manage the APs, broadcast the configured SSID, and applyconsistent security settings across all APs.
using r language for integration theta = integral 0 to infinity (x^4)*e^(-x^2)/2 dx (1) use the density function of standard normal distribution N(0,1) f(x) = 1/sqrt(2pi) * e^(-x^2)/2 -infinity <x<infinity as importance function and obtain an estimate theta 1 for theta set m=100 for the estimate whatt is the estimate theta 1? (2)use the density function of gamma (r=5 λ=1/2)distribution f(x)=λ^r/Γ(r) x^(r-1)e^(-λx) x>=0 as importance function and obtain an estimate theta 2 for theta set m=1000 fir the estimate what is the estimate theta2? (3) use simulation (repeat 1000 times) to estimate the variance of the estimates theta1 and theta 2 which one has smaller variance?
using r language A continuous random variable X has density function f(x)=1/56(3x^2+4x^3+5x^4).0<=x<=2 (1) secify the density g of the random variable Y you find for the acceptance rejection method. (2) what is the value of c you choose to use for the acceptance rejection method (3) use the acceptance rejection method to generate a random sample of size 1000 from the distribution of X .graph the density histogram of the sample and compare it with the density function f(x)
Chapter 8 Solutions
Modern Database Management
Ch. 8 - Prob. 8.1RQCh. 8 - Prob. 8.2RQCh. 8 - Prob. 8.3RQCh. 8 - Prob. 8.4RQCh. 8 - Prob. 8.5RQCh. 8 - Prob. 8.6RQCh. 8 - Prob. 8.7RQCh. 8 - Prob. 8.8RQCh. 8 - Explain why you sometimes have to reserve much...Ch. 8 - Why are field values sometimes coded?
Ch. 8 - Prob. 8.11RQCh. 8 - Prob. 8.12RQCh. 8 - Explain why normalized relations may not comprise...Ch. 8 - Prob. 8.14RQCh. 8 - List three common situations that suggest that...Ch. 8 - Explain the reasons why some experts are against...Ch. 8 - Prob. 8.17RQCh. 8 - Prob. 8.18RQCh. 8 - Prob. 8.19RQCh. 8 - Prob. 8.20RQCh. 8 - Prob. 8.21RQCh. 8 - Prob. 8.22RQCh. 8 - One of the strongest recommendations regarding...Ch. 8 - Explain why an index is useful only if there is...Ch. 8 - Indexing can clearly be very beneficial. Why...Ch. 8 - Prob. 8.26RQCh. 8 - Prob. 8.27RQCh. 8 - Describe the role of data dictionary in the...Ch. 8 - Prob. 8.29RQCh. 8 - Prob. 8.30RQCh. 8 - Explain how creating a view may increase data...Ch. 8 - Prob. 8.32RQCh. 8 - Prob. 8.33RQCh. 8 - Prob. 8.34RQCh. 8 - Prob. 8.35RQCh. 8 - Prob. 8.36RQCh. 8 - Prob. 8.37RQCh. 8 - Prob. 8.38RQCh. 8 - Prob. 8.39RQCh. 8 - How can views be used as part of data security?...Ch. 8 - Prob. 8.41RQCh. 8 - Prob. 8.42RQCh. 8 - Consider the following two relations for...Ch. 8 - Prob. 8.44PAECh. 8 - Prob. 8.45PAECh. 8 - Prob. 8.46PAECh. 8 - Prob. 8.47PAECh. 8 - Suppose you are designing a default value for the...Ch. 8 - When a student has not chosen a major at a...Ch. 8 - Prob. 8.50PAECh. 8 - Prob. 8.51PAECh. 8 - Consider the relations in Problem and Exercise...Ch. 8 - Prob. 8.53PAECh. 8 - Prob. 8.54PAECh. 8 - Prob. 8.55PAECh. 8 - Prob. 8.56PAECh. 8 - Prob. 8.57PAECh. 8 - Consider the relations specified in Problem and...Ch. 8 - Prob. 8.59PAECh. 8 - Prob. 8.60PAECh. 8 - Prob. 8.61PAECh. 8 - Prob. 8.62PAECh. 8 - Prob. 8.63PAECh. 8 - Prob. 8.64PAECh. 8 - Problems and Exercises 8-65 through 8-68 refer to...Ch. 8 - Prob. 8.66PAECh. 8 - Problems and Exercises 8-65i5 through 8-68 refer...Ch. 8 - Refer to Figure 4-5 0. For each of the following...Ch. 8 - Prob. 8.69PAECh. 8 - Prob. 8.70PAECh. 8 - Prob. 8.71PAECh. 8 - Prob. 8.72PAECh. 8 - Prob. 8.73PAECh. 8 - Prob. 8.74PAECh. 8 - Prob. 8.75PAECh. 8 - Prob. 8.76PAECh. 8 - Prob. 8.77PAE
Knowledge Booster
Learn more about
Need a deep-dive on the concept behind this application? Look no further. Learn more about this topic, computer-science and related others by exploring similar questions and additional content below.Similar questions
- using r language a continuous random variable X has density function f(x)=1/4x^3e^-(pi/2)^4,x>=0 derive the probability inverse transformation F^(-1)x where F(x) is the cdf of the random variable Xarrow_forwardusing r language in an accelerated failure test, components are operated under extreme conditions so that a substantial number will fail in a rather short time. in such a test involving two types of microships 600 chips manufactured by an existing process were tested and 125 of them failed then 800 chips manufactured by a new process were tested and 130 of them failed what is the 90%confidence interval for the difference between the proportions of failure for chips manufactured by two processes? using r languagearrow_forwardI want a picture of the tools and the pictures used Cisco Packet Tracer Smart Home Automation:o Connect a temperature sensor and a fan to a home gateway.o Configure the home gateway so that the fan is activated when the temperature exceedsa set threshold (e.g., 30°C).2. WiFi Network Configuration:o Set up a wireless LAN with a unique SSID.o Enable WPA2 encryption to secure the WiFi network.o Implement MAC address filtering to allow only specific clients to connect.3. WLC Configuration:o Deploy at least two wireless access points connected to a Wireless LAN Controller(WLC).o Configure the WLC to manage the APs, broadcast the configured SSID, and applyconsistent security settings across all APs.arrow_forward
- A. What will be printed executing the code above?B. What is the simplest way to set a variable of the class Full_Date to January 26 2020?C. Are there any empty constructors in this class Full_Date?a. If there is(are) in which code line(s)?b. If there is not, how would an empty constructor be? (create the code lines for it)D. Can the command std::cout << d1.m << std::endl; be included after line 28 withoutcausing an error?a. If it can, what will be printed?b. If it cannot, how could this command be fixed?arrow_forwardCisco Packet Tracer Smart Home Automation:o Connect a temperature sensor and a fan to a home gateway.o Configure the home gateway so that the fan is activated when the temperature exceedsa set threshold (e.g., 30°C).2. WiFi Network Configuration:o Set up a wireless LAN with a unique SSID.o Enable WPA2 encryption to secure the WiFi network.o Implement MAC address filtering to allow only specific clients to connect.3. WLC Configuration:o Deploy at least two wireless access points connected to a Wireless LAN Controller(WLC).o Configure the WLC to manage the APs, broadcast the configured SSID, and applyconsistent security settings across all APs.arrow_forwardTransform the TM below that accepts words over the alphabet Σ= {a, b} with an even number of a's and b's in order that the output tape head is positioned over the first letter of the input, if the word is accepted, and all letters a should be replaced by the letter x. For example, for the input aabbaa the tape and head at the end should be: [x]xbbxx z/z,R b/b,R F ① a/a,R b/b,R a/a, R a/a,R b/b.R K a/a,R L b/b,Rarrow_forward
- Given the C++ code below, create a TM that performs the same operation, i.e., given an input over the alphabet Σ= {a, b} it prints the number of letters b in binary. 1 #include 2 #include 3 4- int main() { std::cout > str; for (char c : str) { if (c == 'b') count++; 5 std::string str; 6 int count = 0; 7 char buffer [1000]; 8 9 10 11- 12 13 14 } 15 16- 17 18 19 } 20 21 22} std::string binary while (count > 0) { binary = std::to_string(count % 2) + binary; count /= 2; std::cout << binary << std::endl; return 0;arrow_forwardConsidering the CFG described below, answer the following questions. Σ = {a, b} • NT = {S} Productions: P1 S⇒aSa P2 P3 SbSb S⇒ a P4 S⇒ b A. List one sequence of productions that can accept the word abaaaba; B. Give three 5-letter words that can be accepted by this CFG; C. Create a Pushdown automaton capable of accepting the language accepted by this CFG.arrow_forwardGiven the FSA below, answer the following questions. b 1 3 a a b b с 2 A. Write a RegEx that is equivalent to this FSA as it is; B. Write a RegEx that is equivalent to this FSA removing the states and edges corresponding to the letter c. Note: To both items feel free to use any method you want, including analyzing which words are accepted by the FSA, to generate your RegEx.arrow_forward
- 3) Finite State Automata Given the FSA below, answer the following questions. a b a b 0 1 2 b b 3 A. Give three 4-letter words that can be accepted by this FSA; B. Give three 4-letter words that cannot be accepted by this FSA; C. How could you describe the words accepted by this FSA? D. Is this FSA deterministic or non-deterministic?arrow_forwardConsidering the TM below, answer the following questions. a/x,R €/E,L €/E,R €/E,L x/E,R c/c,R b/E.L c/c,L x/x,R I J K L M F b/E.L D A. Give three 4-letter words that can be accepted by this TM; B. Give three 4-letter words that cannot be accepted by this TM; C. How could you describe the words accepted by this TM? D. What is the alphabet of the language accepted by this TM?arrow_forwardWhat is the generator? Explain motor generator motorarrow_forward
arrow_back_ios
SEE MORE QUESTIONS
arrow_forward_ios
Recommended textbooks for you
 Database Systems: Design, Implementation, & Manag...Computer ScienceISBN:9781305627482Author:Carlos Coronel, Steven MorrisPublisher:Cengage Learning
 Database Systems: Design, Implementation, & Manag...Computer ScienceISBN:9781285196145Author:Steven, Steven Morris, Carlos Coronel, Carlos, Coronel, Carlos; Morris, Carlos Coronel and Steven Morris, Carlos Coronel; Steven Morris, Steven Morris; Carlos CoronelPublisher:Cengage Learning
 A Guide to SQLComputer ScienceISBN:9781111527273Author:Philip J. PrattPublisher:Course Technology PtrNp Ms Office 365/Excel 2016 I NtermedComputer ScienceISBN:9781337508841Author:CareyPublisher:Cengage
 Operations Research : Applications and AlgorithmsComputer ScienceISBN:9780534380588Author:Wayne L. WinstonPublisher:Brooks Cole

Database Systems: Design, Implementation, & Manag...
Computer Science
ISBN:9781305627482
Author:Carlos Coronel, Steven Morris
Publisher:Cengage Learning

Database Systems: Design, Implementation, & Manag...
Computer Science
ISBN:9781285196145
Author:Steven, Steven Morris, Carlos Coronel, Carlos, Coronel, Carlos; Morris, Carlos Coronel and Steven Morris, Carlos Coronel; Steven Morris, Steven Morris; Carlos Coronel
Publisher:Cengage Learning


A Guide to SQL
Computer Science
ISBN:9781111527273
Author:Philip J. Pratt
Publisher:Course Technology Ptr

Np Ms Office 365/Excel 2016 I Ntermed
Computer Science
ISBN:9781337508841
Author:Carey
Publisher:Cengage

Operations Research : Applications and Algorithms
Computer Science
ISBN:9780534380588
Author:Wayne L. Winston
Publisher:Brooks Cole
Enhanced Entity Relationship Model; Author: Data Science Center;https://www.youtube.com/watch?v=ocQUtXPumdQ;License: Standard YouTube License, CC-BY