Principles of Managerial Finance (14th Edition) (Pearson Series in Finance)
14th Edition
ISBN: 9780133507690
Author: Lawrence J. Gitman, Chad J. Zutter
Publisher: PEARSON
expand_more
expand_more
format_list_bulleted
Textbook Question
Chapter 8, Problem 8.17P
Learning Goal 5
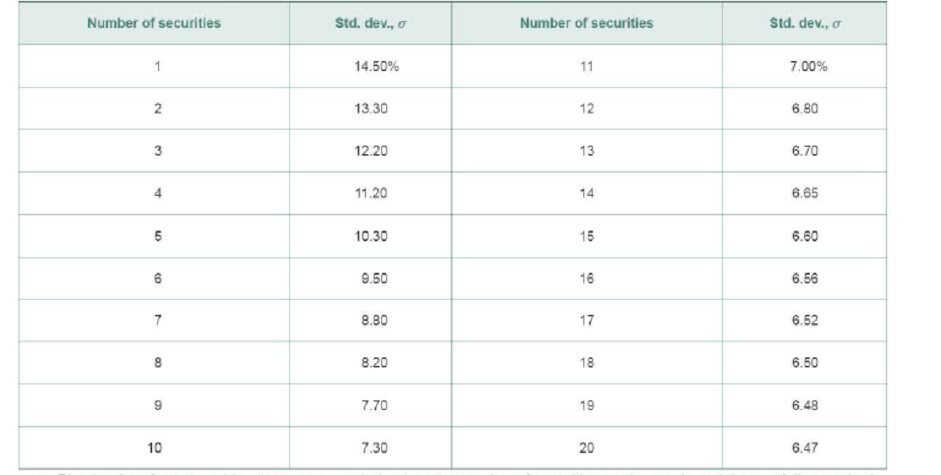
P8- 17 Total, nondiversifiable, and diversifiable risk David Talbot randomly selected securities from all those listed on the New York Stock Exchange for his portfolio. He began with a single security and added securities one by one until a total of 20 securities were held in the portfolio. After each security was added, David calculated the portfolio standard deviation, σ. The calculated values are shown in the following table

- a. Plot the data from the table above on a graph that has the number of sec unites on the x-axis and the portfolio standard deviation on the y-axis.
- b. Divide the total portfolio risk in the graph into its nondiversifiable and diversifiable risk components, and label each of these on the graph.
- c. Describe which of the two risk components is the relevant risk, and explain why it is relevant. How much of this risk exists in David Talbot’s portfolio?
Expert Solution & Answer
Want to see the full answer?
Check out a sample textbook solution
Students have asked these similar questions
The Fortune Company is considering a new investment. Financial projections for the investment are tabulated below. The corporate tax rate is 24 percent. Assume all sales revenue is received in cash, all operating costs and income taxes are paid in cash, and all cash flows occur at the end of the year. All net working capital is recovered at the end of the project.
Year 0
Year 1
Year 2
Year 3
Year 4
Investment
$ 28,000
Sales revenue
$ 14,500
$ 15,000
$ 15,500
$ 12,500
Operating costs
3,100
3,200
3,300
2,500
Depreciation
7,000
7,000
7,000
7,000
Net working capital spending
340
390
440
340
?
What are the six types of alternative case study compositional structures (formats)used for research purposes, such as: 1. Linear-Analytical, 2. Comparative, 3. Chronological, 4. Theory Building, 5. Suspense and 6. Unsequenced. Please explain
For an operating lease, substantially all the risks and rewards of ownership remain with the _________.
QuestFor an operating lease, substantially all the risks and rewards of ownership remain with the _________:
A) Tenant
b) Lessee
lessor
none of the above
tenant
lessee
lessor
none of the aboveLeasing allows the _________ to acquire the use of a needed asset without having to make the large up-front payment that purchase agreements require
Question 4 options:
lessor
lessee
landlord
none of the above
Chapter 8 Solutions
Principles of Managerial Finance (14th Edition) (Pearson Series in Finance)
Ch. 8.1 - Prob. 1FOECh. 8.1 - What is risk in the context of financial decision...Ch. 8.1 - Prob. 8.2RQCh. 8.1 - Prob. 8.3RQCh. 8.2 - Explain how the range is used in scenario...Ch. 8.2 - Prob. 8.5RQCh. 8.2 - Prob. 8.6RQCh. 8.2 - What does the coefficient of variation reveal...Ch. 8.3 - What is an efficient portfolio? How can the return...Ch. 8.3 - Prob. 8.9RQ
Ch. 8.3 - How does international diversification enhance...Ch. 8.4 - Prob. 8.11RQCh. 8.4 - Prob. 8.12RQCh. 8.4 - Prob. 8.13RQCh. 8.4 - What impact would the following changes have on...Ch. 8 - Prob. 1ORCh. 8 - Prob. 8.1STPCh. 8 - Prob. 8.2STPCh. 8 - Prob. 8.1WUECh. 8 - Prob. 8.2WUECh. 8 - Prob. 8.3WUECh. 8 - Prob. 8.4WUECh. 8 - Prob. 8.5WUECh. 8 - Prob. 8.6WUECh. 8 - Prob. 8.1PCh. 8 - Prob. 8.2PCh. 8 - Prob. 8.3PCh. 8 - Prob. 8.4PCh. 8 - Prob. 8.5PCh. 8 - Learning Goal 2 P8-6 Bar charts and risk Swans...Ch. 8 - Prob. 8.7PCh. 8 - Prob. 8.8PCh. 8 - Prob. 8.9PCh. 8 - Prob. 8.10PCh. 8 - Prob. 8.11PCh. 8 - Prob. 8.12PCh. 8 - Prob. 8.13PCh. 8 - Prob. 8.14PCh. 8 - Learning Goal 4 P8- 15 Correlation, risk, and...Ch. 8 - Prob. 8.16PCh. 8 - Learning Goal 5 P8- 17 Total, nondiversifiable,...Ch. 8 - Prob. 8.18PCh. 8 - Prob. 8.19PCh. 8 - Prob. 8.20PCh. 8 - Prob. 8.21PCh. 8 - Prob. 8.22PCh. 8 - Prob. 8.23PCh. 8 - Prob. 8.24PCh. 8 - Prob. 8.25PCh. 8 - Prob. 8.26PCh. 8 - Prob. 8.27PCh. 8 - Learning Goal 6 P8- 28 Security market line (SML)...Ch. 8 - Prob. 8.29PCh. 8 - Prob. 8.30PCh. 8 - Prob. 8.31PCh. 8 - Prob. 1SE
Knowledge Booster
Learn more about
Need a deep-dive on the concept behind this application? Look no further. Learn more about this topic, finance and related others by exploring similar questions and additional content below.Similar questions
- How has AirBnb negatively affected the US and global economy? How has Airbnb negatively affected the real estate market? How has Airbnb negatively affected homeowners and renters market? What happened to Airbnb in the Tax Dispute in Italy?arrow_forwardHow has AirBnb positively affected the US and global economy? How has Airbnb positively affected the real estate market? How has Airbnb positively affected homeowners and renters market?arrow_forwardD. (1) Consider the following cash inflows of a financial product. Given that the market interest rate is 12%, what price would you pay for these cash flows? Year 0 1 2 3 4 Cash Flow 160 170 180 230arrow_forward
- Explain why financial institutions generally engage in foreign exchange tradingactivities. Provide specific purposes or motivations behind such activities.arrow_forwardA. In 2008, during the global financial crisis, Lehman Brothers, one of the largest investment banks, collapsed and defaulted on its corporate bonds, causing significant losses for bondholders. This event highlighted several risks that investors in corporate bonds might face. What are the key risks an investor would encounter when investing in corporate bonds? Explain these risks with examples or academic references. [15 Marks]arrow_forwardTwo companies, Blue Plc and Yellow Plc, have bonds yielding 4% and 5.3%respectively. Blue Plc has a credit rating of AA, while Yellow Plc holds a BB rating. If youwere a risk-averse investor, which bond would you choose? Explain your reasoning withacademic references.arrow_forward
- B. Using the probabilities and returns listed below, calculate the expected return and standard deviation for Sparrow Plc and Hawk Plc, then justify which company a risk- averse investor might choose. Firm Sparrow Plc Hawk Plc Outcome Probability Return 1 50% 8% 2 50% 22% 1 30% 15% 2 70% 20%arrow_forward(2) Why are long-term bonds more susceptible to interest rate risk than short-term bonds? Provide examples to explain. [10 Marks]arrow_forwardDon't used Ai solutionarrow_forward
- Don't used Ai solutionarrow_forwardScenario one: Under what circumstances would it be appropriate for a firm to use different cost of capital for its different operating divisions? If the overall firm WACC was used as the hurdle rate for all divisions, would the riskier division or the more conservative divisions tend to get most of the investment projects? Why? If you were to try to estimate the appropriate cost of capital for different divisions, what problems might you encounter? What are two techniques you could use to develop a rough estimate for each division’s cost of capital?arrow_forwardScenario three: If a portfolio has a positive investment in every asset, can the expected return on a portfolio be greater than that of every asset in the portfolio? Can it be less than that of every asset in the portfolio? If you answer yes to one of both of these questions, explain and give an example for your answer(s). Please Provide a Referencearrow_forward
arrow_back_ios
SEE MORE QUESTIONS
arrow_forward_ios
Recommended textbooks for you
 EBK CONTEMPORARY FINANCIAL MANAGEMENTFinanceISBN:9781337514835Author:MOYERPublisher:CENGAGE LEARNING - CONSIGNMENT

EBK CONTEMPORARY FINANCIAL MANAGEMENT
Finance
ISBN:9781337514835
Author:MOYER
Publisher:CENGAGE LEARNING - CONSIGNMENT

Chapter 8 Risk and Return; Author: Michael Nugent;https://www.youtube.com/watch?v=7n0ciQ54VAI;License: Standard Youtube License