
Mindtap Business Analytics, 1 Term (6 Months) Printed Access Card For Camm/cochran/fry/ohlmann/anderson/sweeney/williams' Essentials Of Business Analytics, 2nd
2nd Edition
ISBN: 9781305861794
Author: Jeffrey D. Camm, James J. Cochran, Michael J. Fry, Jeffrey W. Ohlmann, David R. Anderson
Publisher: Cengage Learning
expand_more
expand_more
format_list_bulleted
Videos
Textbook Question
Chapter 8, Problem 6P
Consider the following time series data:
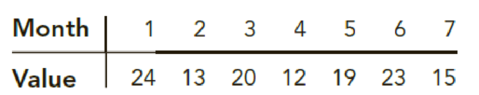
- a. Construct a time series plot. What type of pattern exists in the data?
- b. Develop a three-week moving average for this time series. Compute MSE and a forecast for week 8.
- c. Use α = 0.2 to compute the exponential smoothing values for the time series. Compute MSE and a forecast for week 8.
- d. Compare the three-week moving average forecast with the exponential smoothing forecast using α = 0.2. Which appears to provide the better forecast based on MSE?
- e. Use trial and error to find a value of the exponential smoothing coefficient α that results in a smaller MSE than what you calculated for α = 0.2.
Expert Solution & Answer
Want to see the full answer?
Check out a sample textbook solution
Students have asked these similar questions
Cycles to
failure
Position in
ascending
order
0.5
f(x))
(x;)
Problem 44
Marsha, a renowned cake scientist, is trying to determine how long different cakes can survive intense fork attacks before collapsing into crumbs.
To simulate real-world cake consumption, she designs a test where cakes are subjected to repeated fork stabs and bites, mimicking the brutal
reality of birthday parties. After rigorous testing, Marsha records 10 observations of how many stabs each cake endured before structural failure.
Construct P-P plots for (a.) a normal distribution, (b.) a lognormal distribution, and (c.) a Weibull distribution (using the information included in the
table below). Which distribution seems to be the best model for the cycles to failure for this material? Explain your answer in detail.
Observation
Empirical
cumulative
Probability distribution
Cumulative distribution
Inverse of cumulative
distribution F-1 (-0.5)
F(x))
(S)
n
4
3
1
0.05
9
5
2
0.15
7
7
3
0.25
1
10
4
0.35
3
12
5
0.45
Normal…
Problem 3
In their lab, engineer Daniel and Paulina are desperately trying to perfect time travel. But the problem is that
their machine still struggles with power inconsistencies-sometimes generating too little energy, other times
too much, causing unstable time jumps. To prevent catastrophic misjumps into the Jurassic era or the far
future, they must calibrate the machine's power output. After extensive testing, they found that the time
machine's power output follows a normal distribution, with an average energy level of 8.7 gigawatts and a
standard deviation of 1.2 gigawatts.
The Time Travel Safety Board has set strict guidelines: For a successful time jump, the
machine's power must be between 8.5 and 9.5 gigawatts. What is the probability that a randomly
selected time jump meets this precision requirement?
Daniel suggests that adjusting the mean power output could improve time-travel accuracy.
Can adjusting the mean reduce the number of dangerous misjumps? If yes, what should the…
Problem 5 (
Marybeth is also interested in the experiment from Problem 2 (associated with the enhancements for Captain
America's shield), so she decides to start a detailed literature review on the subject. Among others, she found
a paper where they used a 2"(4-1) fractional factorial design in the factors: (A) shield material, (B) throwing
mechanism, (C) edge modification, and (D) handle adjustment. The experimental design used in the paper is
shown in the table below.
a.
Run
A
B
с
D
1
(1)
-1
-1
-1
1
2
a
1
-1
-1
1
3
bd
-1
1
-1
1
4
abd
1
1
-1
1
5
cd
-1
-1
1
-1
6
acd
1
-1
1
-1
7
bc
-1
1
1
-1
abc
1
1
1
-1
paper?
s) What was the generator used in the 2"(4-1) fractional factorial design described in the
b.
Based on the resolution of this design, what do you think about the generator used in the
paper? Do you think it was a good choice, or would you have selected a different one? Explain your
answer in detail.
Chapter 8 Solutions
Mindtap Business Analytics, 1 Term (6 Months) Printed Access Card For Camm/cochran/fry/ohlmann/anderson/sweeney/williams' Essentials Of Business Analytics, 2nd
Ch. 8 - Consider the following time series data:
Using...Ch. 8 - Refer to the time series data in Problem 1. Using...Ch. 8 - Problems 1 and 2 used different forecasting...Ch. 8 - Consider the following time series data:
Compute...Ch. 8 - Consider the following time series...Ch. 8 - Consider the following time series...Ch. 8 - Refer to the gasoline sales time series data in...Ch. 8 - Prob. 8PCh. 8 - Prob. 9PCh. 8 - Prob. 10P
Ch. 8 - For the Hawkins Company, the monthly percentages...Ch. 8 - Corporate triple A bond interest rates for 12...Ch. 8 - The values of Alabama building contracts (in...Ch. 8 - The following time series shows the sales of a...Ch. 8 - Prob. 15PCh. 8 - The following table reports the percentage of...Ch. 8 - Consider the following time series: a. Construct a...Ch. 8 - Consider the following time series:
Construct a...Ch. 8 - Because of high tuition costs at state and private...Ch. 8 - The Seneca Children’s Fund (SCF) is a local...Ch. 8 - The president of a small manufacturing firm is...Ch. 8 - Consider the following time series: a. Construct a...Ch. 8 - Consider the following time series...Ch. 8 - The quarterly sales data (number of copies sold)...Ch. 8 - Prob. 25PCh. 8 - South Shore Construction builds permanent docks...Ch. 8 - Hogs & Dawgs is an ice cream parlor on the border...Ch. 8 - Donna Nickles manages a gasoline station on the...Ch. 8 - The Vintage Restaurant, on Captiva Island near...
Knowledge Booster


Learn more about
Need a deep-dive on the concept behind this application? Look no further. Learn more about this topic, statistics and related others by exploring similar questions and additional content below.Similar questions
- Suppose we wish to test the hypothesis that women with a sister’s history of breast cancer are at higher risk of developing breast cancer themselves. Suppose we assume that the prevalence rate of breast cancer is 3% among 60- to 64-year-old U.S. women, whereas it is 5% among women with a sister history. We propose to interview 400 women 40 to 64 years of age with a sister history of the disease. What is the power of such a study assuming that the level of significance is 10%? I only need help writing the null and alternative hypotheses.arrow_forward4.96 The breaking strengths for 1-foot-square samples of a particular synthetic fabric are approximately normally distributed with a mean of 2,250 pounds per square inch (psi) and a standard deviation of 10.2 psi. Find the probability of selecting a 1-foot-square sample of material at random that on testing would have a breaking strength in excess of 2,265 psi.4.97 Refer to Exercise 4.96. Suppose that a new synthetic fabric has been developed that may have a different mean breaking strength. A random sample of 15 1-foot sections is obtained, and each section is tested for breaking strength. If we assume that the population standard deviation for the new fabric is identical to that for the old fabric, describe the sampling distribution forybased on random samples of 15 1-foot sections of new fabricarrow_forwardUne Entreprise œuvrant dans le domaine du multividéo donne l'opportunité à ses programmeurs-analystes d'évaluer la performance des cadres supérieurs. Voici les résultats obtenues (sur une échelle de 10 à 50) où 50 représentent une excellente performance. 10 programmeurs furent sélectionnés au hazard pour évaluer deux cadres. Un rapport Excel est également fourni. Programmeurs Cadre A Cadre B 1 34 36 2 32 34 3 18 19 33 38 19 21 21 23 7 35 34 8 20 20 9 34 34 10 36 34 Test d'égalité des espérances: observations pairéesarrow_forward
- A television news channel samples 25 gas stations from its local area and uses the results to estimate the average gas price for the state. What’s wrong with its margin of error?arrow_forwardYou’re fed up with keeping Fido locked inside, so you conduct a mail survey to find out people’s opinions on the new dog barking ordinance in a certain city. Of the 10,000 people who receive surveys, 1,000 respond, and only 80 are in favor of it. You calculate the margin of error to be 1.2 percent. Explain why this reported margin of error is misleading.arrow_forwardYou find out that the dietary scale you use each day is off by a factor of 2 ounces (over — at least that’s what you say!). The margin of error for your scale was plus or minus 0.5 ounces before you found this out. What’s the margin of error now?arrow_forward
- Suppose that Sue and Bill each make a confidence interval out of the same data set, but Sue wants a confidence level of 80 percent compared to Bill’s 90 percent. How do their margins of error compare?arrow_forwardSuppose that you conduct a study twice, and the second time you use four times as many people as you did the first time. How does the change affect your margin of error? (Assume the other components remain constant.)arrow_forwardOut of a sample of 200 babysitters, 70 percent are girls, and 30 percent are guys. What’s the margin of error for the percentage of female babysitters? Assume 95 percent confidence.What’s the margin of error for the percentage of male babysitters? Assume 95 percent confidence.arrow_forward
- You sample 100 fish in Pond A at the fish hatchery and find that they average 5.5 inches with a standard deviation of 1 inch. Your sample of 100 fish from Pond B has the same mean, but the standard deviation is 2 inches. How do the margins of error compare? (Assume the confidence levels are the same.)arrow_forwardA survey of 1,000 dental patients produces 450 people who floss their teeth adequately. What’s the margin of error for this result? Assume 90 percent confidence.arrow_forwardThe annual aggregate claim amount of an insurer follows a compound Poisson distribution with parameter 1,000. Individual claim amounts follow a Gamma distribution with shape parameter a = 750 and rate parameter λ = 0.25. 1. Generate 20,000 simulated aggregate claim values for the insurer, using a random number generator seed of 955.Display the first five simulated claim values in your answer script using the R function head(). 2. Plot the empirical density function of the simulated aggregate claim values from Question 1, setting the x-axis range from 2,600,000 to 3,300,000 and the y-axis range from 0 to 0.0000045. 3. Suggest a suitable distribution, including its parameters, that approximates the simulated aggregate claim values from Question 1. 4. Generate 20,000 values from your suggested distribution in Question 3 using a random number generator seed of 955. Use the R function head() to display the first five generated values in your answer script. 5. Plot the empirical density…arrow_forward
arrow_back_ios
SEE MORE QUESTIONS
arrow_forward_ios
Recommended textbooks for you
 Trigonometry (MindTap Course List)TrigonometryISBN:9781305652224Author:Charles P. McKeague, Mark D. TurnerPublisher:Cengage Learning
 Big Ideas Math A Bridge To Success Algebra 1: Stu...AlgebraISBN:9781680331141Author:HOUGHTON MIFFLIN HARCOURTPublisher:Houghton Mifflin Harcourt
 Glencoe Algebra 1, Student Edition, 9780079039897...AlgebraISBN:9780079039897Author:CarterPublisher:McGraw Hill
 Trigonometry (MindTap Course List)TrigonometryISBN:9781337278461Author:Ron LarsonPublisher:Cengage Learning
Trigonometry (MindTap Course List)
Trigonometry
ISBN:9781305652224
Author:Charles P. McKeague, Mark D. Turner
Publisher:Cengage Learning
Big Ideas Math A Bridge To Success Algebra 1: Stu...
Algebra
ISBN:9781680331141
Author:HOUGHTON MIFFLIN HARCOURT
Publisher:Houghton Mifflin Harcourt
Glencoe Algebra 1, Student Edition, 9780079039897...
Algebra
ISBN:9780079039897
Author:Carter
Publisher:McGraw Hill
Trigonometry (MindTap Course List)
Trigonometry
ISBN:9781337278461
Author:Ron Larson
Publisher:Cengage Learning
Time Series Analysis Theory & Uni-variate Forecasting Techniques; Author: Analytics University;https://www.youtube.com/watch?v=_X5q9FYLGxM;License: Standard YouTube License, CC-BY
Operations management 101: Time-series, forecasting introduction; Author: Brandoz Foltz;https://www.youtube.com/watch?v=EaqZP36ool8;License: Standard YouTube License, CC-BY