Concept explainers
Draw the influence lines for the shear and bending moment at point F.
Explanation of Solution
Equation of influence line ordinate of support B:
Apply a 1 k unit moving load at a distance of x from left end D.
Sketch the free body diagram of frame as shown in Figure 1.
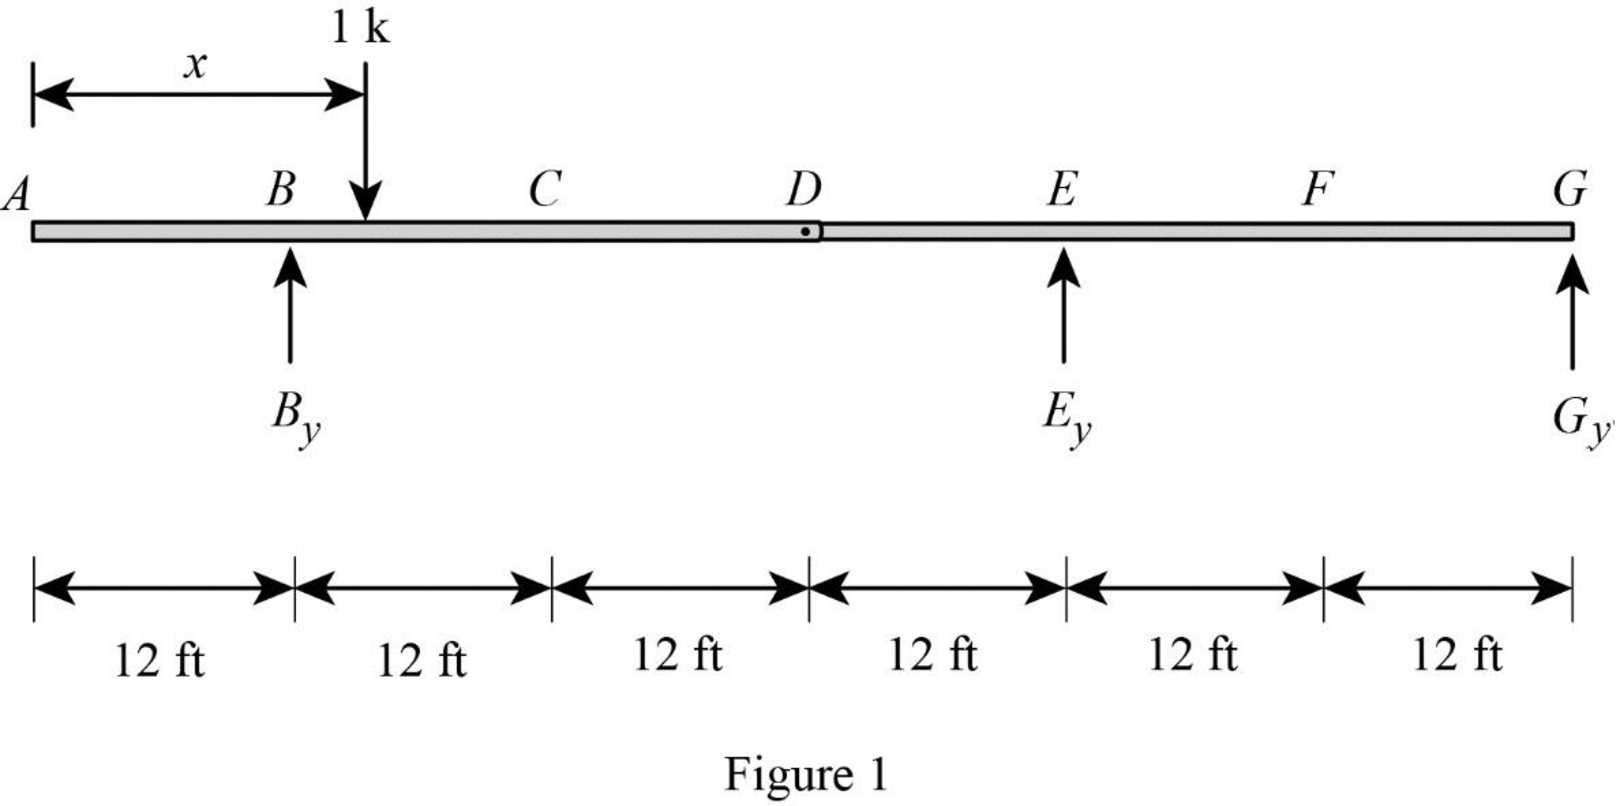
Refer Figure 1.
Consider the unit load at a variable position x to the left hinge D. (placed portion AC of the beam
Find the vertical support reaction
Take Moment at hinge D from left end A.
Consider clockwise moment as positive and anticlockwise moment as negative.
Consider the unit load at a variable position x to the right hinge D. (Place portion DG of the beam
Find the vertical support reaction
Take Moment at hinge D from left end A.
Consider clockwise moment as positive and anticlockwise moment as negative.
Thus, the equations of the influence line ordinate for
Equation of influence line ordinate of support E:
Refer Figure 1.
Find the equation of influence line ordinate for the vertical reaction
Apply moment equilibrium at G.
Consider clockwise moment as positive and anticlockwise moment as negative.
Find the influence line ordinate of vertical reaction
Substitute
Find the influence line ordinate of vertical reaction
Substitute
Thus, the equations of the influence line ordinate for
Equation of influence line ordinate of support G:
Refer Figure 1.
Find the equation of influence line ordinate for the vertical reaction
Consider the vertical forces equilibrium condition, take the upward force as positive
Find the influence line ordinate of vertical reaction
Substitute
Find the influence line ordinate of vertical reaction
Substitute
Thus, the equations of the influence line ordinate for
Influence line for shear at point F.
Find the equation of shear at F of portion AG
Sketch the free body diagram of the section AD as shown in Figure 2.
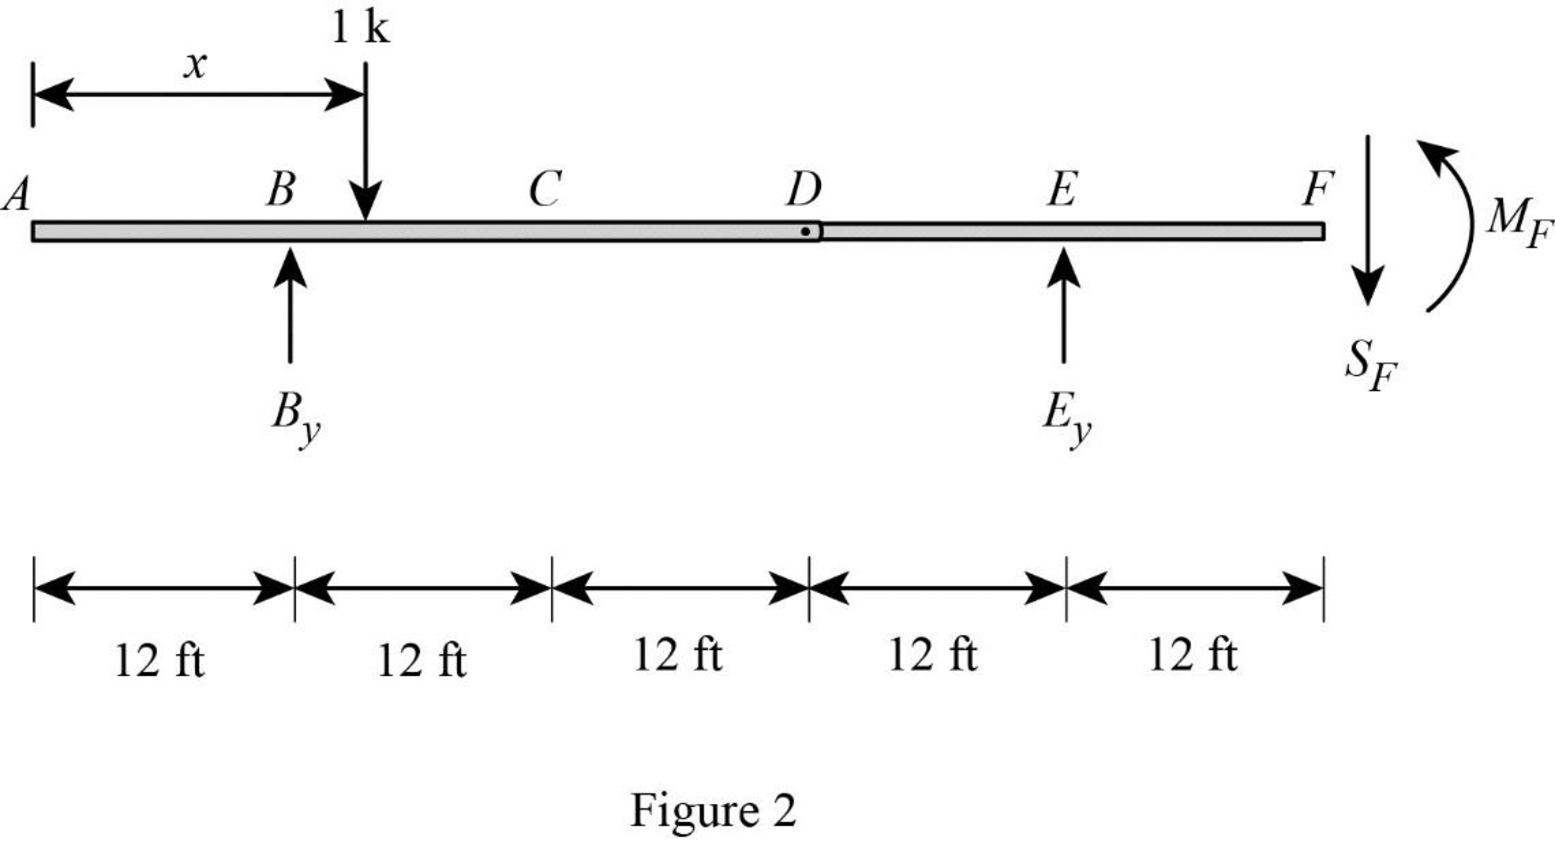
Refer Figure 2.
Apply equilibrium equation of forces.
Consider upward force as positive
Find the influence line ordinate of shear at F
Substitute
Find the influence line ordinate of shear at F
Substitute
Find the equation of shear at F of portion FG
Sketch the free body diagram of the section FG as shown in Figure 3.
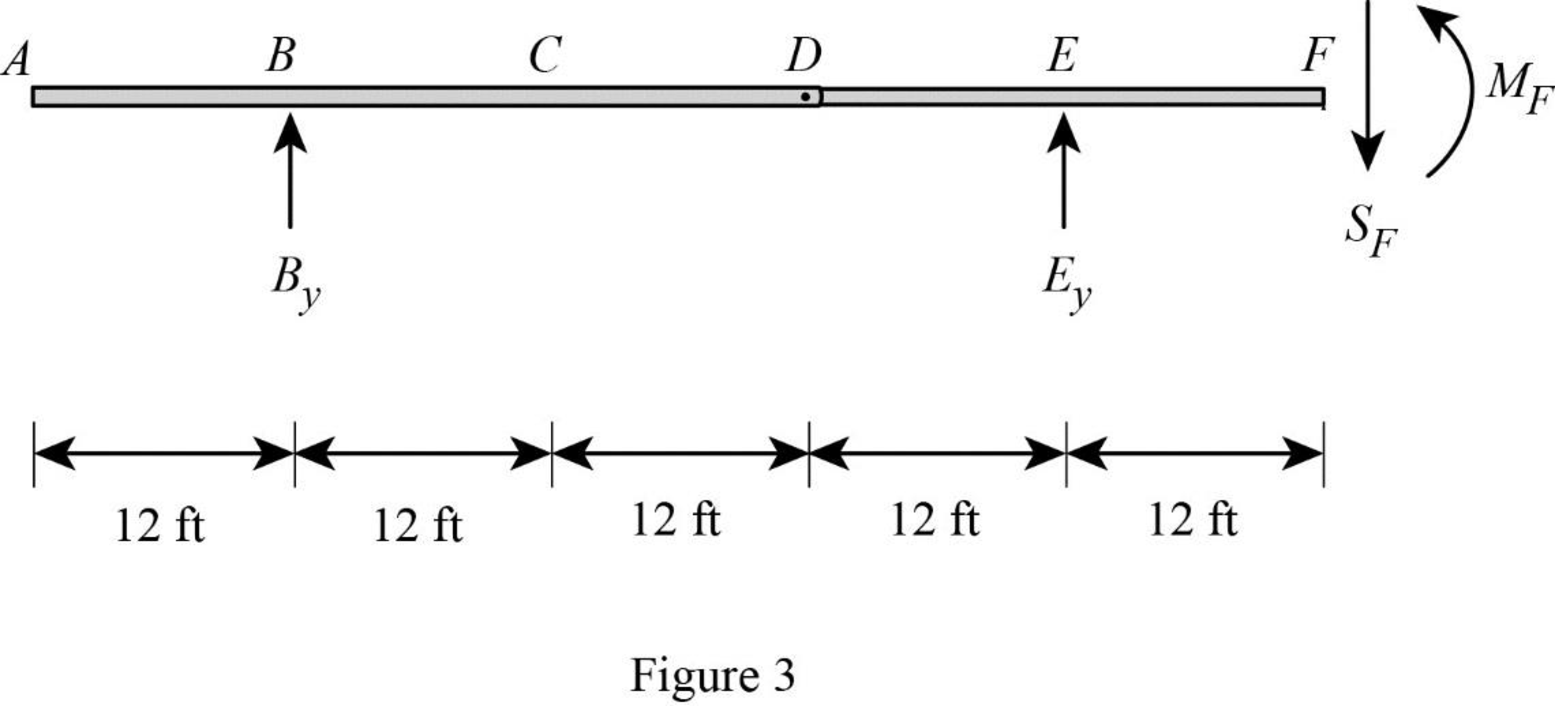
Refer Figure 3.
Apply equilibrium equation of forces.
Consider upward force as positive
Substitute 0 for
Thus, the equations of the influence line ordinate for
Find the influence line ordinate of
| x (ft) | Points | Influence line ordinate of |
| 0 | A | |
| 12 | 0 | |
| 24 | C | 0.25 |
| 36 | D | 0.5 |
| 48 | ||
| 60 | ||
| 60 | 0.5 | |
| 72 | G | 0 |
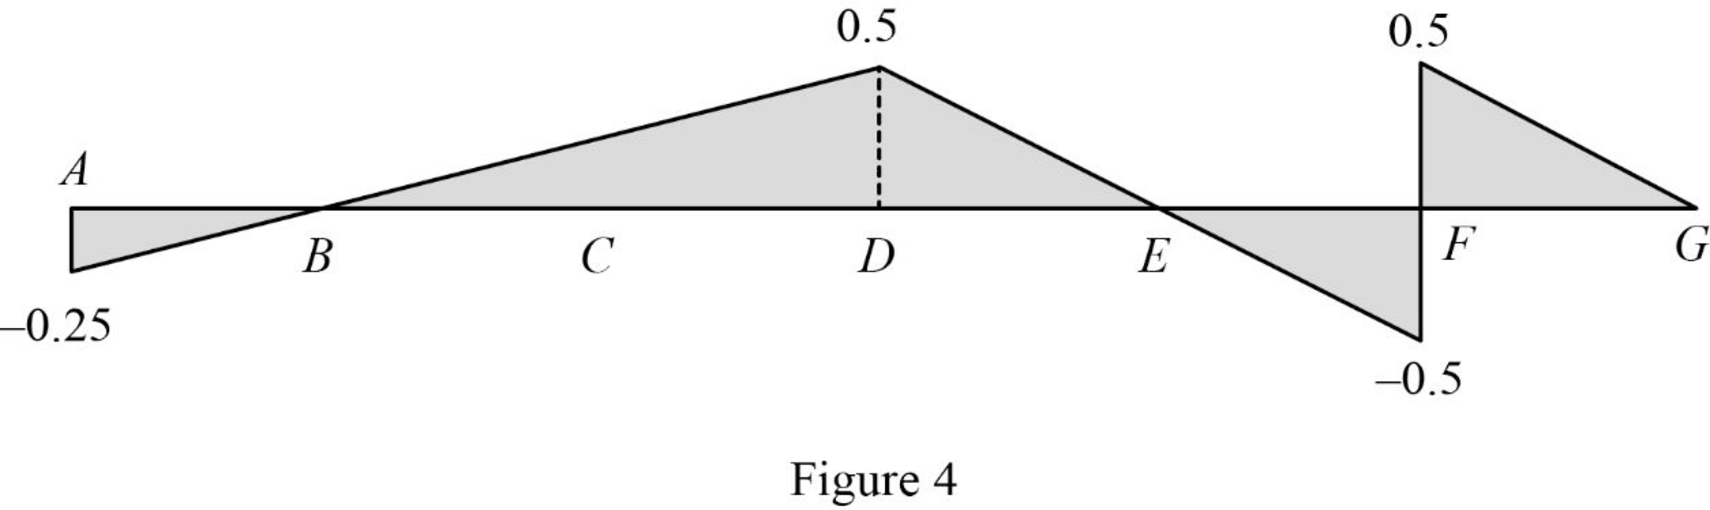
Sketch the influence line diagram for the shear at point F as shown in Figure 4.
Refer Figure 2.
Find the equation of bending moment at E of portion AD
Take moment at F.
Consider clockwise moment as positive and anticlockwise moment as negative.
Find the influence line ordinate of bending moment at F
Substitute
Find the influence line ordinate of bending moment at F
Substitute
Refer Figure 3.
Find the equation of bending moment at F of portion FG
Take moment at F.
Consider clockwise moment as negative and anticlockwise moment as positive.
Substitute
Thus, the equations of the influence line ordinate for
Find the influence line ordinate of
| x (ft) | Points | Influence line ordinate of |
| 0 | A | 3 |
| 12 | 0 | |
| 24 | C | |
| 36 | D | |
| 48 | E | 0 |
| 60 | F | 6 |
| 72 | G | 0 |
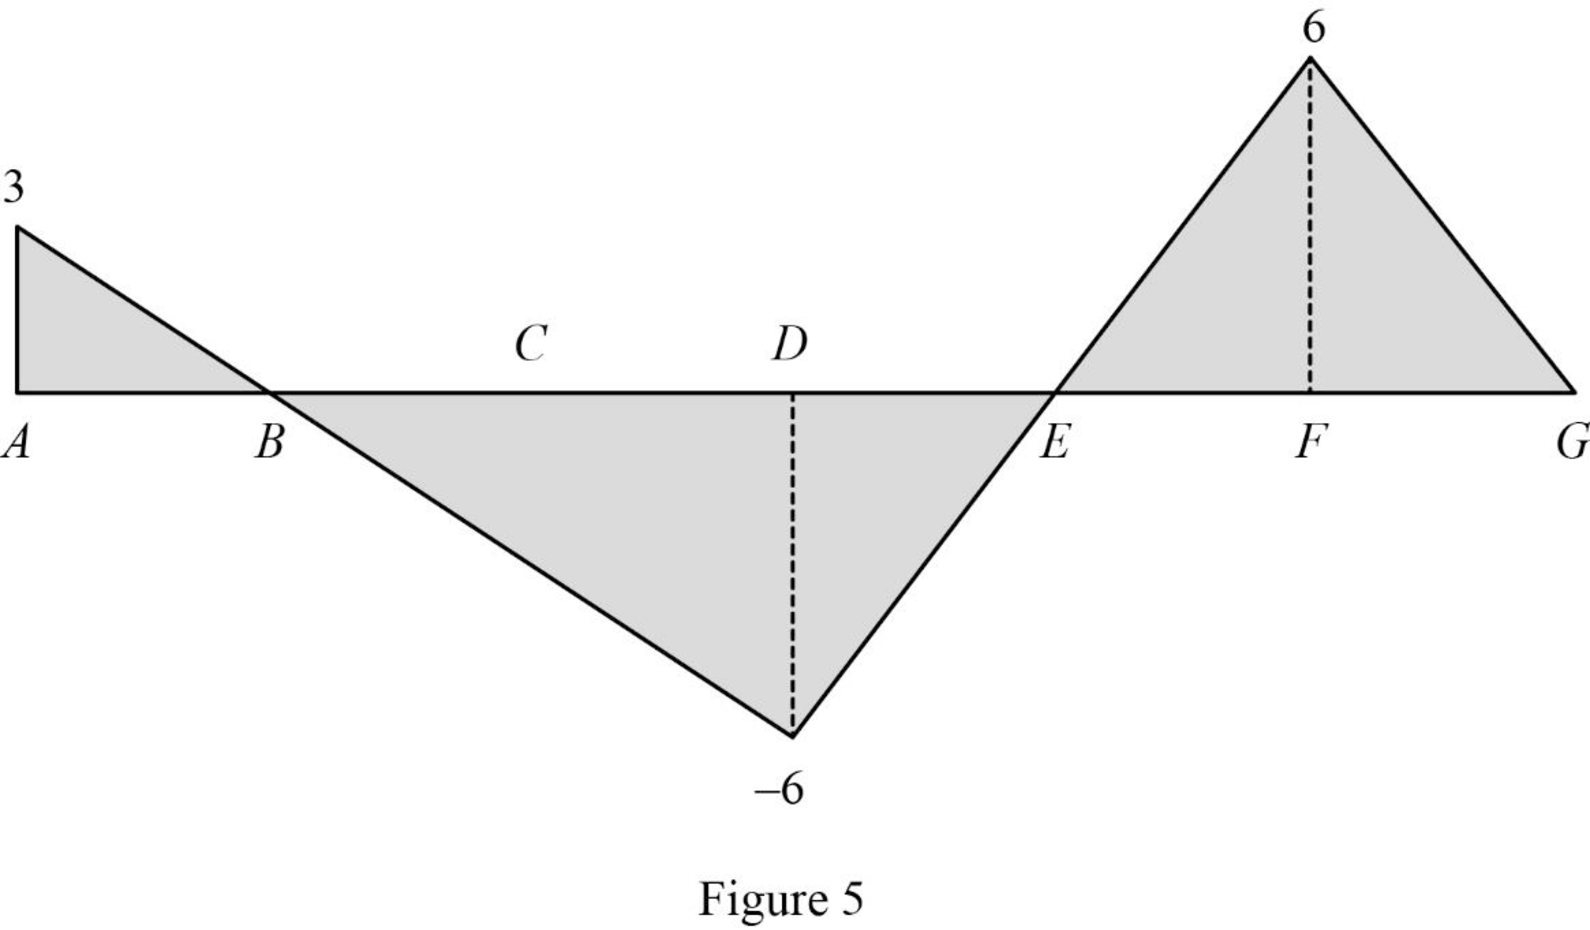
Sketch the influence line diagram for the bending moment at point F as shown in Figure 5.
Want to see more full solutions like this?
Chapter 8 Solutions
Structural Analysis (MindTap Course List)


- Q1. Statically indeterminate beam analysis. a) Calculate the BMs (bending moments) at all the joints of the beam shown in Fig.1 using the moment distribution method. The beam is subjected to an UDL of w kN/m. L1= 0.4L. Assume the support at C is pinned, and A and B are roller supports. E = 200 GPa, I=250x106 mm². Use the values of w = 50 kN/m and L = 6 b) Draw the shear force and bending diagrams for the entire beam. c) Calculate the BMs at all the joints of the same beam shown in Fig.1 using the slope deflection method. d) Compare the values of BMs obtained using the two methods a) and c) and comment. w kN/m £1m Lm m Fig 1. Beam for Q1arrow_forwardI have the answer provided for the question, just looking for a more detailed breadown of how it was obtained thanks.arrow_forwardQ5.--Finite-element-modelling. a) → Draw-a-2D-element-and-show-the dots (degrees of freedom). Draw-all-the-2D-elements. used-in-Strand 7..Explain the differences between-these-elements-in-terms-of-the-no..of. nodes-and-interpolation/shape-functions used. b)→A-8-m-x-8-m-plate (in-the-xx-plane)-with-8-mm-thickness, is fixed-at-all-the-edges.and.is. loaded-by-a-pressure-loading-of-4 kN/m2.-in-the-downward-(-2)-direction.-The-plate.is. made-of-steel-(E=-200 GPa, density-7850-kg/m3). Explain-the-steps-involved-in-setting. up-a-Strand 7-model-for-this-problem. Your-explanation-should-include-how-the-given. input-data-for-this-problem-will-be-used-in-Strand 7-modelling. Explain how you would. determine the maximum-deflection-from-the-Strand 7-output.-1 11arrow_forward
- I need Help some hw for AutoCAD please use measure front top and side viewarrow_forwardCalculate the discharge of the system shown below. Neglecting minor losessarrow_forwardQ3. Statically determinate or indeterminate beam analysis by the stiffness method a) Determine the global stiffness matrix of the beam shown in Fig. 3. Assume supports at 1 and 3 are rollers and the support at 2 is a pinned support. Indicate the degrees- of freedom in all the stiffness matrices. El is constant. Use the values of w = 50 kN/m and L1 = 2.0 m Note, L2-3L1. b) Determine the rotations at all the nodes of the beam and reactions at the supports. Show all calculations. c) Draw the BMD of the beam on the compression side showing the salient values. What are the maximum bending moments of the beam? Draw the deflected shape of the beam. d) Solve the problem using the Strand7. Assume any suitable value of El (state the value you have used for El). Show the model with all the nodes, element numbers and boundary conditions. Display the deflected shape and BMD. e) Show a table comparing the stiffness method (manual calculations) of the all the reactions and the maximum bending moment…arrow_forward
- Using AutoCAD. I need help please to exact measurearrow_forwardDraw Isometric view of this multiview of object.arrow_forwardREMINDER: The truss must be cut into two different sections. You can choose either one to solve as you will get the same answer. Since there are three equations available, you can't cut more than three members 6.25 Determine the force in members BD, CD, and CE of the truss shown. BO C 36 kips 36 kips D F H 7.5 ft E G 4 panels at 10 ft = 40 ftarrow_forward
- Calculate the area of the following polygon using the abscissa and projection method, taking into account the necessary adjustments before calculating the area of the polygon using the compass rule. Latitude Departure Side 930.63 N 930.63 S 1272 E 1271 W AB 122.14 E=12/2-1271-1 cr=-1 680 BC 173.83 length 591 CD 669.13 109.08 DE 139.36 961.1 EA 756.80 201.82 330.63/ 430.65 DEP=L SIN (O) >L DEP/SIN(O) LAT = L COS (0) DEPILATESIN(OYCOS (0)= TAN (0) O TAN-1 (DEP/LAT)= asztan Deptarrow_forwardEstimate the material quantities (cement, sand, gravel, and steel reinforcement) required for constructing 120 m concrete channel of the following typical cross section, concrete mix of 1:1.5:3 and thickness of 20 cm. Figure (1) Figure (1) 12250- 16300arrow_forwarda) A 14-ft. tall and12-ft.-8-in. long fully grouted reinforced masonry wall is constructed of 8-in.CMU. It is to be analyzed for out-of-plane loading. Construct thenP -nM curves for the wallwith the following three vertical reinforcement scenarios: (1) 10 No. 6 bars at 16 in. spacing,(2) 10 No. 5 bars at 16 in. spacing, and (3) 7 No. 4 bars at 24 in. spacing. The steel is Grade60 with a modulus of elasticity of 29,000 ksi, and the masonry has a compressive strength of2,000 psi. You may use Excel or Matlab to construct the curves. Also, show the maximumnPallowed by the code for each case.(b) For each of the above reinforcement scenarios, determine the maximum axial loads that arepermitted for the tension-controlled condition and transition condition.(c) Discuss how the amount of vertical reinforcement affects thenPn-Mn curve.arrow_forward
