
Concept explainers
Draw the influence lines for the vertical reactions at supports A and C.
Draw the influence lines for the shear and bending moment at point B.
Explanation of Solution
Calculation:
Apply a 1 k unit moving load at a distance of x from left end A.
Sketch the free body diagram of beam as shown in Figure 1.
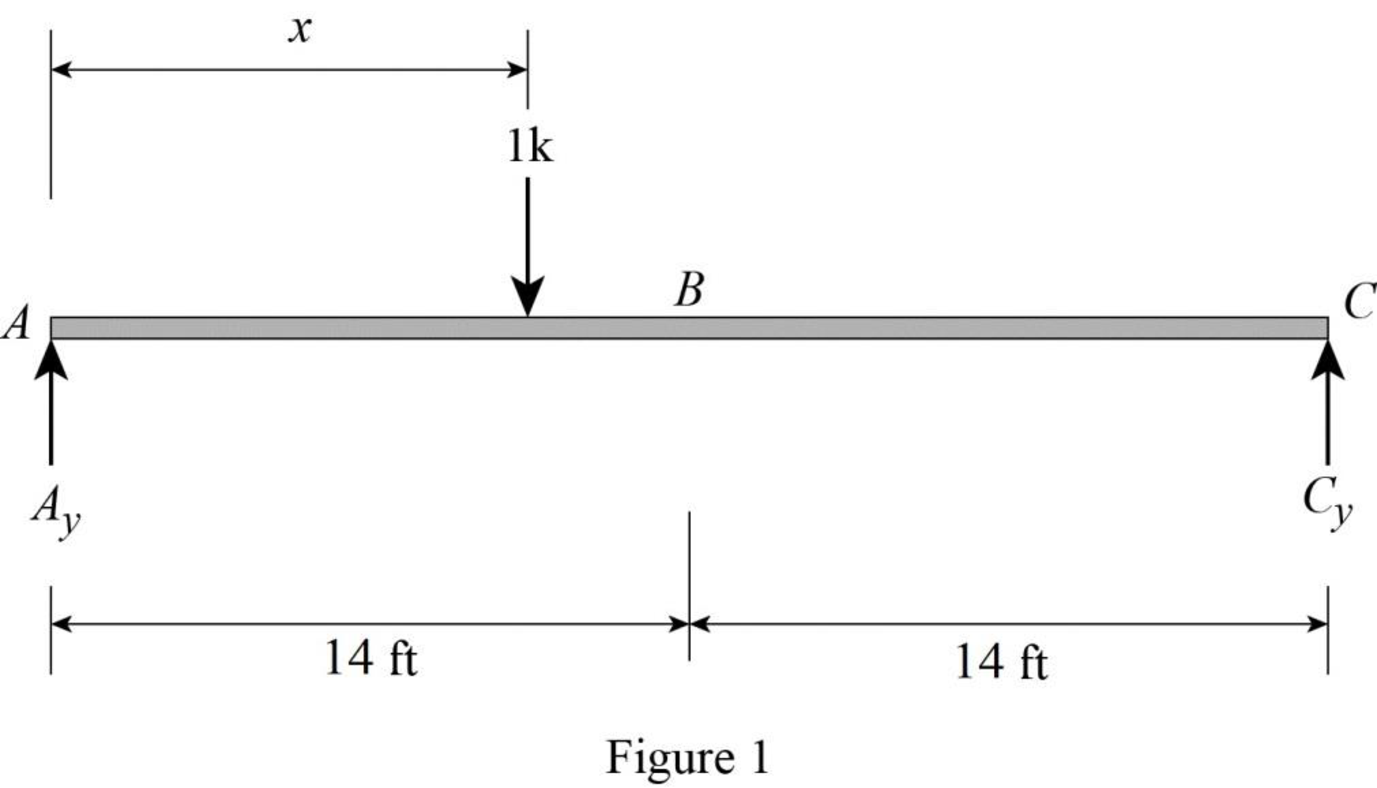
Refer Figure 1.
Find the equation of support reaction
Take moment about point C.
Consider moment equilibrium at point C.
Consider clockwise moment as positive and anticlockwise moment as negative.
Sum of moment at point C is zero.
Find the equation of support reaction
Apply vertical equilibrium equation of forces.
Consider upward force as positive
Substitute
Consider Equation (1).
Find the value of influence line ordinate of reaction
Substitute 0 for x in Equation (1).
Similarly calculate the influence line ordinate of reaction
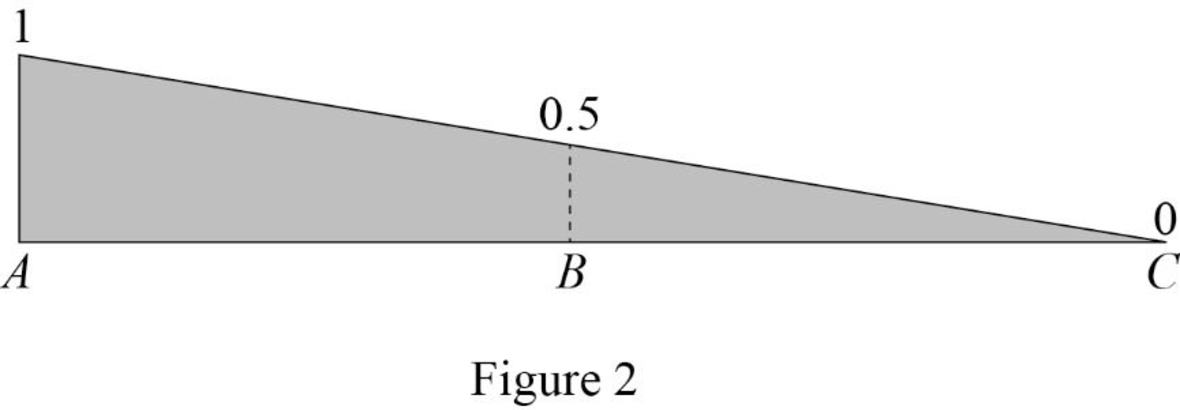
| x | |
| 0 | 1 |
| 14 | 0.5 |
| 28 | 0 |
Draw the influence line diagram for the vertical reactions at support A using Table 1 as shown in Figure 2.
Consider Equation (2).
Find the influence line ordinate of reaction
Substitute 28 for x in Equation (2).
Similarly calculate the influence line ordinate of reaction
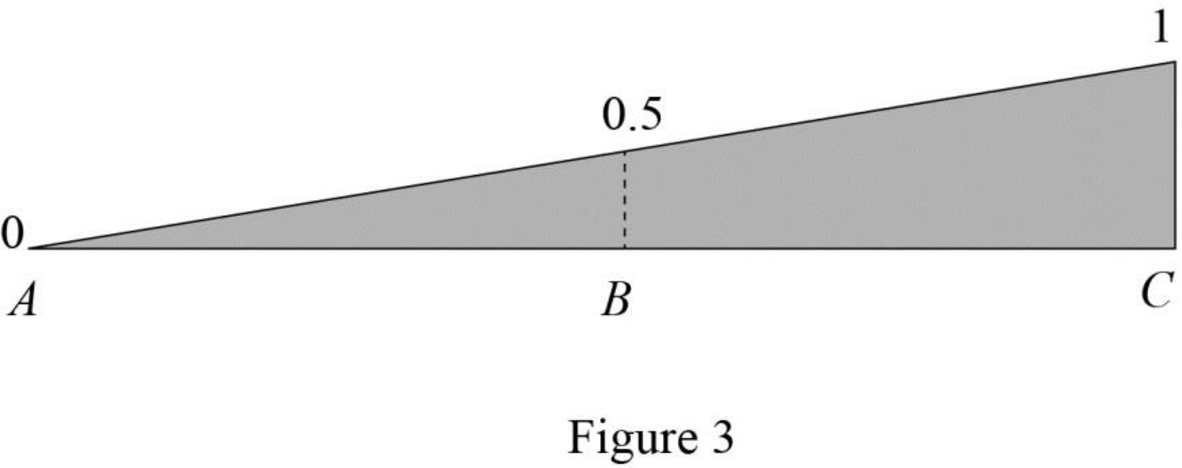
| x | |
| 0 | 0 |
| 14 | 0.5 |
| 28 | 1 |
Draw the influence line diagram for the vertical reactions at support C using Table 2 as shown in Figure 3.
Find the equation of shear force at B of portion AB
Sketch the free body diagram of the section AB as shown in Figure 4.
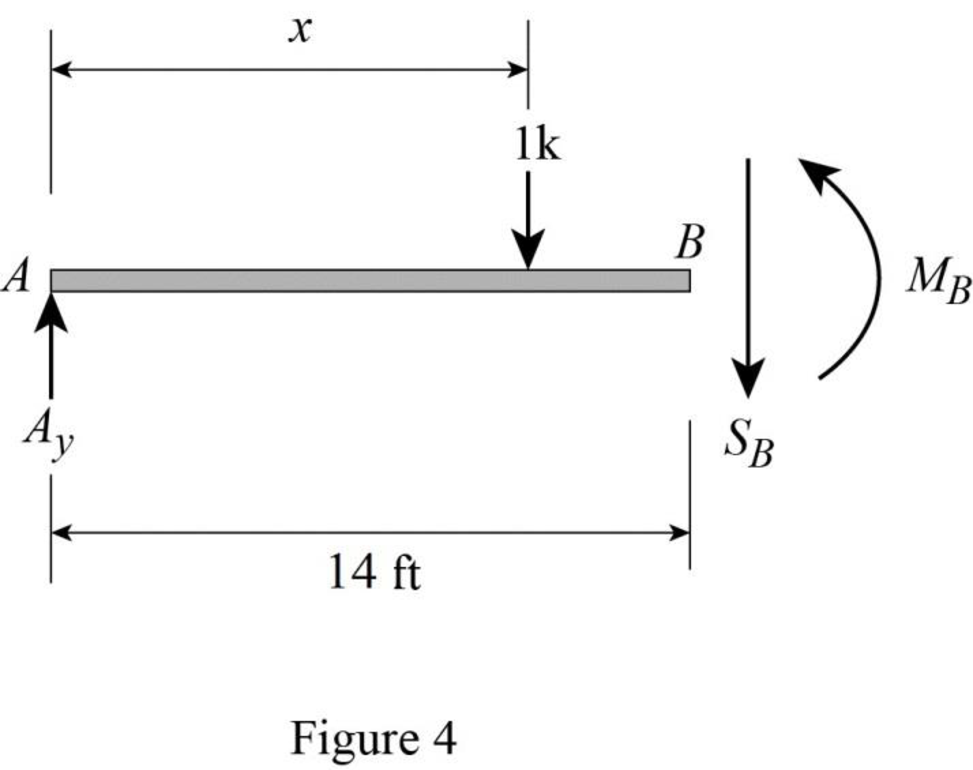
Refer Figure 4.
Apply equilibrium equation of forces.
Consider upward force as positive
Substitute
Find the equation of shear force at B of portion BC
Sketch the free body diagram of the section BC as shown in Figure 5.
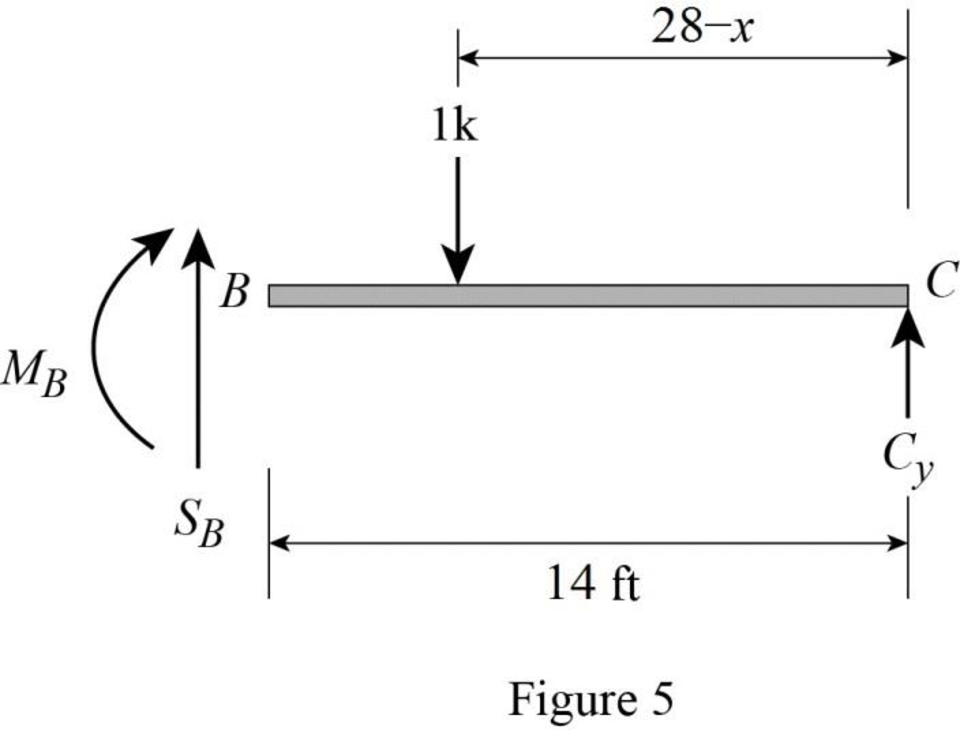
Refer Figure 5.
Apply equilibrium equation of forces.
Consider upward force as positive
Substitute
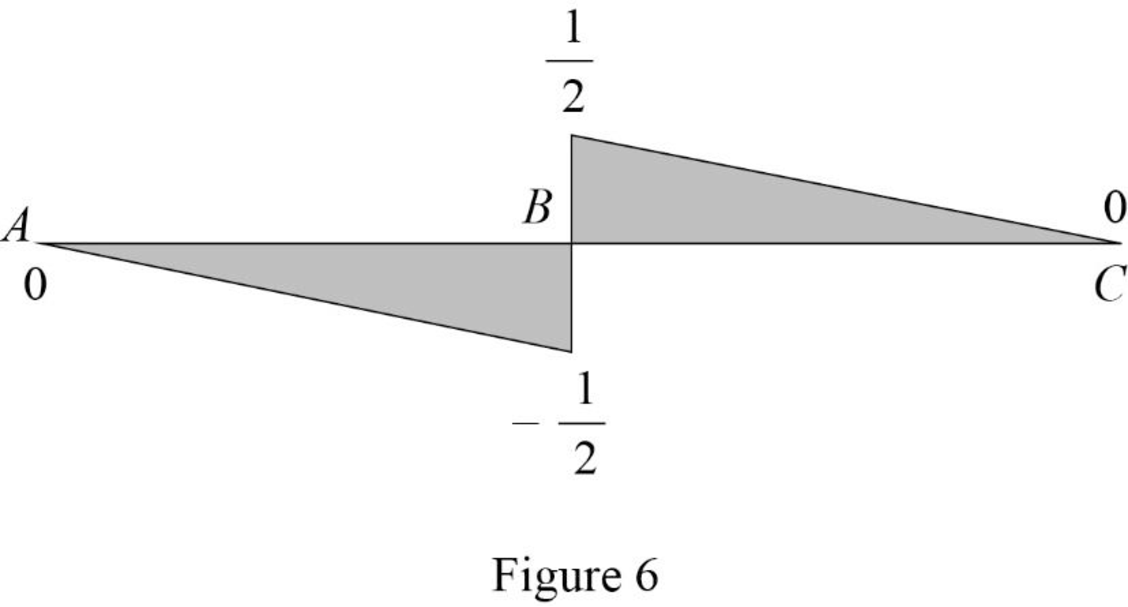
Thus, the equations of the influence line for
Find the value of influence line ordinate of shear force at various points of x using the Equations (3) and (4) and summarize the value as in Table 3.
| x | |
| 0 | 1 |
| 28 | 0 |
Draw the influence lines for the shear force at point B using Table 3 as shown in Figure 6.
Refer Figure 4.
Consider clockwise moment as positive and anticlockwise moment as negative.
Find the equation of moment at B of portion AB
Substitute
Refer Figure 5.
Consider clockwise moment as negative and anticlockwise moment as positive.
Find the equation of moment at B of portion BC
Substitute
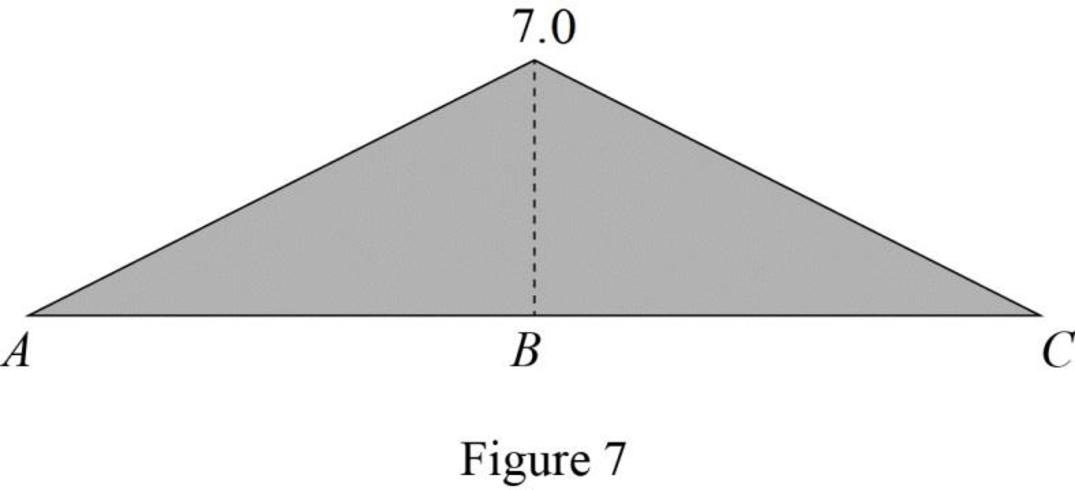
Thus, the equations of the influence line for
Find the value of influence line ordinate of moment at various points of x using the Equations (5) and (6) and summarize the value as in Table 4.
| x | |
| 0 | 0 |
| 14 | |
| 28 | 0 |
Draw the influence lines for the moment at point B using Table 4 as shown in Figure 7.
Therefore, the influence lines for the vertical reactions at supports A and C and the influence lines for the shear and bending moment at point B are drawn.
Want to see more full solutions like this?
Chapter 8 Solutions
Structural Analysis (MindTap Course List)


- Civil engineering quantities question Answer the question and at the end put notes on how a BOQ is constructed.arrow_forwardPlanning is underway for the construction of a new railway section between Stockholm and Uppsala as part of the "Fyra spår Uppsala" project. Your task is to carry out a preliminary slope stability analysis for a planned road underpass beneath the new railway. The analysis concerns the eastern slope at the underpass. The designed clay slope has a depth of 12.5 meters and a width of 27.0 meters. According to geotechnical investigations, the soil consists of homogeneous, overconsolidated clay with a saturated unit weight of 15 kN/m³ and an undrained shear strength of 35 kPa. The groundwater table is at ground level (0.0 m). According to Figure 1, the most critical slip surface is circular, with the center of rotation (point O) located 4.0 meters above the current ground surface (0.0 m). The slip surface intersects the ground at the toe of the slope and 6.0 meters east of the slope crest. Questions to Answer Calculate the factor of safety (F) against rotational failure using an undrained…arrow_forwardQuestion 6. Water enters a reach of rectangular channel where y₁ = 0.5 m, b = 7.5 m, and Q = 20 m³/s (Figure P10.39). It is desired that a hydraulic jump occur upstream (location 2) of the sill and on the sill critical conditions exist (loca- tion 3). Other than across the jump, losses can be neglected. Determine the following: (a) Depths at locations 2 and 3 (b) Required height of the sill, h (c) Resultant force acting on the sill (d) Sketch the water surface and energy grade line. (e) Describe the nature and character of the jump. 1 2 3. harrow_forward
- Question 5. This figure shows a cross section of an aqueduct that carries water at 50 m³/s. The value of Manning's n is 0.02. Find the bottom slope. 45° 4.0 m 7.0 m-arrow_forwardQuestion 4. A rectangular, unfinished concrete channel of 30-ft width is laid on a slope of 7 ft/mi. Determine the flow depth and Froude number of the flow if the flowrate is 350 ft³/s.arrow_forwardQuestion 3. A lake discharges into a steep channel. At the channel entrance the lake is 4 m above the channel bottom. Neglecting losses, find the discharge for the following geometries: (a) Rectangular section, b = 4 m (b) Trapezoidal section, b = 3 m, angle = 60° (c) Circular section, d = 3.5 m.arrow_forward
- Question 7. A popular sharp-crested weir for use in low-flow situations is the V-notch weir, as shown below. When these weirs are designed, the equation for determining the flowrate by neglecting the velocity head of the upstream flow can be written as Q = CH", where C is a coefficient of discharge and is a function of the notch angle (0) and n is a weir constant. The constants C and n must be determined experimentally for a given weir. In logarithmic form, the weir equation is log Q = n log H + log C. Assume we have a flume in the lab where we can experimentally explore the relationship between Q and H for this weir by adjusting the flowrates. Develop an appropriate experiment to determine n and C' (the weir discharge coefficient) for the weir used. Write the experimental procedure steps and measurement readings that are needed to determine these coefficients empirically. Hint: Please refer to your lab manual. Draw down Nappe H V notch weir Weir plate sharp-crested weirarrow_forwardPlease solve the question by hand with a detailed explanation of the steps.arrow_forwardPlease solve the question by hand with a detailed explanation of the steps.arrow_forward
