
Concept explainers
Videos
The Data Bank is found in Appendix B, or on the World Wide Web by following links from www.mhhe.com/math/stats/bluman/
1. From the Data Bank, select a random sample of at least 30 individuals, and test one or more of the following hypotheses by using the z test. Use α = 0.05.
a. For serum cholesterol, H0: μ = 220 milligram percent (mg%). Use σ = 5.
b. For systolic pressure, H0: μ = 120 millimeters of mercury (mm Hg). Use σ = 13.
c. For IQ, H0: μ = 100. Use σ = 15.
d. For sodium level, H0: μ = 140 milliequivalents per liter (mEq/l). Use σ = 6.
a.
To test: The claim that
Answer to Problem 1DA
The conclusion is that there is sufficient evidence to infer that the average serum cholesterol level is differs from 220 milligram percent (mg%).
Explanation of Solution
Answer will vary. One of the possible answers is given below:
Given info:
Claim:
Calculation:
State the null and alternative hypotheses:
Null hypothesis:
Alternative hypothesis:
Test statistic value and P-value:
Software procedure:
Step by step procedure to obtain the test value using the MINITAB software:
- Choose Stat > Basic Statistics > 1-Sample Z.
- In Samples in Column, enter the column of Serum cholesterol.
- In Standard deviation, enter 5.
- In Perform hypothesis test, enter the test mean as 220.
- Check Options; enter Confidence level as 95%.
- Choose not equal in alternative.
- Click OK in all dialogue boxes.
Output using the MINITAB software is given below:
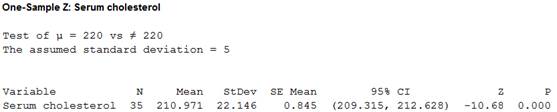
From the output, the test value is –10.68 and the P-value is 0.000.
Make the Decision:
Decision rule:
If
If
Here, the P-value is lesser than the level of significance.
That is,
By the decision rule, the null hypothesis is rejected.
Thus, the decision is “reject the null hypothesis”.
Summarize the result:
There is sufficient evidence to infer that the average serum cholesterol level is differs from 220 milligram percent (mg%).
b.
To test: The claim that
Answer to Problem 1DA
The conclusion is that there is sufficient evidence to infer that the average systolic pressure is differs from 120 millimeters of mercury (mm Hg).
Explanation of Solution
Given info:
Claim:
Calculation:
State the null and alternative hypotheses:
Null hypothesis:
Alternative hypothesis:
Test statistic value and P-value:
Software procedure:
Step by step procedure to obtain the test value using the MINITAB software:
- Choose Stat > Basic Statistics > 1-Sample Z.
- In Samples in Column, enter the column of Systolic pressure.
- In Standard deviation, enter 13.
- In Perform hypothesis test, enter the test mean as 120.
- Check Options; enter Confidence level as 95%.
- Choose not equal in alternative.
- Click OK in all dialogue boxes.
Output using the MINITAB software is given below:
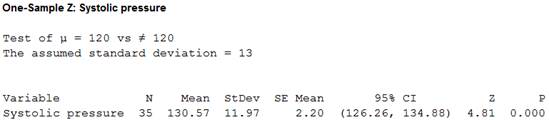
From the output, the test value is 4.81 and the P-value is 0.000.
Make the Decision:
Here, the P-value is lesser than the level of significance.
That is,
By the decision rule, the null hypothesis is rejected.
Thus, the decision is “reject the null hypothesis”.
Summarize the result:
There is sufficient evidence to infer that the average systolic pressure is differs from 120 millimetres of mercury (mm Hg).
c.
To test: The claim that
Answer to Problem 1DA
The conclusion is that there is sufficient evidence to infer that the average IQ score is differs from 100.
Explanation of Solution
Given info:
Claim:
Calculation:
State the null and alternative hypotheses:
Null hypothesis:
Alternative hypothesis:
Test statistic value and P-value:
Software procedure:
Step by step procedure to obtain the test value using the MINITAB software:
- Choose Stat > Basic Statistics > 1-Sample Z.
- In Samples in Column, enter the column of IQ.
- In Standard deviation, enter 15.
- In Perform hypothesis test, enter the test mean as 100.
- Check Options; enter Confidence level as 95%.
- Choose not equal in alternative.
- Click OK in all dialogue boxes.
Output using the MINITAB software is given below:
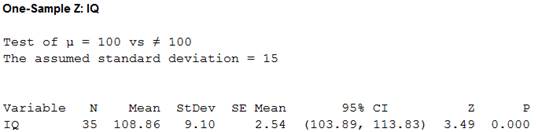
From the output, the test value is 3.49 and the P-value is 0.000.
Make the Decision:
Here, the P-value is lesser than the level of significance.
That is,
By the decision rule, the null hypothesis is rejected.
Thus, the decision is “reject the null hypothesis”.
Summarize the result:
There is sufficient evidence to infer that the average IQ score is differs from 100.
d.
To test: The claim that
Answer to Problem 1DA
The conclusion is that there is sufficient evidence to infer that the average sodium level is 140.
Explanation of Solution
Given info:
Claim:
Calculation:
State the null and alternative hypotheses:
Null hypothesis:
Alternative hypothesis:
Test statistic value and P-value:
Software procedure:
Step by step procedure to obtain the test value using the MINITAB software:
- Choose Stat > Basic Statistics > 1-Sample Z.
- In Samples in Column, enter the column of Sodium level.
- In Standard deviation, enter 6.
- In Perform hypothesis test, enter the test mean as 140.
- Check Options; enter Confidence level as 95%.
- Choose not equal in alternative.
- Click OK in all dialogue boxes.
Output using the MINITAB software is given below:
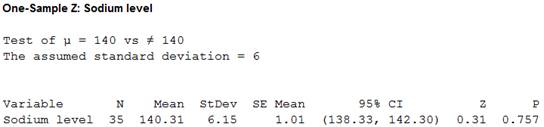
From the output, the test value is 0.31 and the P-value is 0.757.
Make the Decision:
Here, the P-value is greater than the level of significance.
That is,
By the decision rule, the null hypothesis is not rejected.
Thus, the decision is “fail to reject the null hypothesis”.
Summarize the result:
There is sufficient evidence to infer that the average sodium level is 140.
Want to see more full solutions like this?
Chapter 8 Solutions
ALEKS 360 ELEM STATISTICS
Additional Math Textbook Solutions
Pathways To Math Literacy (looseleaf)
Elementary Algebra For College Students (10th Edition)
A First Course in Probability (10th Edition)
Elementary Statistics: Picturing the World (7th Edition)
Algebra and Trigonometry (6th Edition)


- Do bonds reduce the overall risk of an investment portfolio? Let x be a random variable representing annual percent return for the Vanguard Total Stock Index (all Stocks). Let y be a random variable representing annual return for the Vanguard Balanced Index (60% stock and 40% bond). For the past several years, assume the following data. Compute the sample mean for x and for y. Round your answer to the nearest tenth. x: 11 0 36 22 34 24 25 -11 -11 -22 y: 9 -3 28 14 23 16 14 -3 -4 -9arrow_forwardDo bonds reduce the overall risk of an investment portfolio? Let x be a random variable representing annual percent return for the Vanguard Total Stock Index (all Stocks). Let y be a random variable representing annual return for the Vanguard Balanced Index (60% stock and 40% bond). For the past several years, assume the following data. Compute the range for variable y. X 12 0 36 21 35 23 24 -12 -12 -21 Y 10 -2 26 15 22 18 15 -2 -3 -10arrow_forwardDo bonds reduce the overall risk of an investment portfolio? Let x be a random variable representing annual percent return for the Vanguard Total Stock Index (all Stocks). Let y be a random variable representing annual return for the Vanguard Balanced Index (60% stock and 40% bond). For the past several years, assume the following data. Compute the range for variable y. X 12 0 36 21 35 23 24 -12 -12 -21 Y 10 -2 26 15 22 18 15 -2 -3 -10arrow_forward
- Do bonds reduce the overall risk of an investment portfolio? Let x be a random variable representing annual percent return for the Vanguard Total Stock Index (all Stocks). Let y be a random variable representing annual return for the Vanguard Balanced Index (60% stock and 40% bond). For the past several years, assume the following data. Compute the range for variable x. X 15 0 37 23 33 25 26 -15 -15 -23 Y 6 -1 28 18 24 17 18 -1 -2 -6arrow_forward7.16. If the probability density of X is given by g kx³ for x>0 f(x) = (1+2x)6 0 10-01, elsewhere trolls inf ( 2X density of the random variable Y = where k is an appropriate constant, find the probability 1+2X distribution of Y, and thus determine the value of k. 7 Identify thearrow_forward7.1. If X has an exponential distribution with the parameter 0, use the distribution function technique to find the probability density of the random variable Y = ln X. bilaga in dwreatarrow_forward
- 3. Pleasearrow_forwardWhat does the margin of error include? When a margin of error is reported for a survey, it includes a. random sampling error and other practical difficulties like undercoverage and non-response b. random sampling error, but not other practical difficulties like undercoverage and nonresponse c. practical difficulties like undercoverage and nonresponse, but not random smapling error d. none of the above is corretarrow_forwardsolve part a on paperarrow_forward
 Glencoe Algebra 1, Student Edition, 9780079039897...AlgebraISBN:9780079039897Author:CarterPublisher:McGraw Hill